Benchmarking a page protected by a login with Apache Benchmark
Article Table of Contents
I’ve been slowly working through The Complete Guide to Rails Performance. I’m taking the ideas and concepts from Nate’s book and working on applying the lessons to the app I work on in my day job.
I had a chance to attend Nate’s workshop in Denver a few days ago, as well; while there, we fired up our apps in production-like mode, and used wrk, a HTTP benchmarking tool, to see how many pages our app could serve in a given amount of time. (wrk docs).
A normal wrk run might look like so:
$ wrk -t12 -c400 -d30s http://127.0.0.1:8080/index.html
wrk will run for a [t]hread count of 12, with 400 [c]onnections, for a [d]uration of 30 seconds, against 127.0.0.1:8080/index.html
This is fine for testing unprotected home pages, but the app I work on requires a login before getting to anything interesting. So, I wondered
how does one use a HTTP benchmarking tool against an application with a login page?
And I found the answer.
Apache Benchmark #
Apache Benchmark describes itself as [an] Apache HTTP server benchmarking tool. Similar to wrk, but a bit more feature-rich.
You can use it very similarly to wrk - give it a thread count, connection count, duration, and address, and it’ll hammer that page and serve up all sorts of good results.
The “rule of thumb” for benchmarking “protected” pages is:
Whatever page you can access locally in an incognito browser is what your benchmarking tool can hit without any special authentication.
In other words, when I visit http://localhost:3000/ locally, I get redirected to http://localhost:3000/users/sign_in. This is fine for apache bench, if I want to test how quickly our sign-in page loads. I can run:
$ ab -t 10 http://127.0.0.1:3000/
which returns:
Benchmarking 127.0.0.1 (be patient)
Finished 690 requests


Server Software:
Server Hostname:        127.0.0.1
Server Port:            3000

Document Path:          /
Document Length:        101 bytes

Concurrency Level:      1
Time taken for tests:   10.007 seconds
Complete requests:      690
Failed requests:        0
Non-2xx responses:      690
Total transferred:      1380000 bytes
HTML transferred:       69690 bytes
Requests per second:    68.95 [#/sec] (mean)
Time per request:       14.503 [ms] (mean)
Time per request:       14.503 [ms] (mean, across all concurrent requests)
Transfer rate:          134.67 [Kbytes/sec] received

Connection Times (ms)
              min  mean[+/-sd] median   max
Connect:        0    0   0.1      0       1
Processing:     8   14   6.3     12      49
Waiting:        8   14   6.2     12      48
Total:          8   14   6.3     13      49

Percentage of the requests served within a certain time (ms)
  50%     13
  66%     14
  75%     17
  80%     18
  90%     22
  95%     28
  98%     33
  99%     39
 100%     49 (longest request)
If you tail -f log/development.log you can see all the traffic/requests.
This report has a giant red flag, though. It has these three lines:
Complete requests:      690
Failed requests:        0
Non-2xx responses:      690
2xx responses are “success” responses; The HTTP status code returned for each one of these 690 requests was something besides “successful”.
That’s because http://127.0.0.1:3000/ redirects to http://127.0.0.1:3000/users/sign_in; I imagine it’s getting 3xx HTTP status codes, trying to redirect it to /users/sign_in.
So, if we re-build our AP call, we can improve things:
$ ab -t 10 http://127.0.0.1:3000/users/sign_in
The results are quite a bit better. Notice no failed requests, and no non-2xx requests?
Benchmarking 127.0.0.1 (be patient)
Finished 682 requests


Server Software:
Server Hostname:        127.0.0.1
Server Port:            3000

Document Path:          /users/sign_in
Document Length:        9502 bytes

Concurrency Level:      1
Time taken for tests:   10.004 seconds
Complete requests:      682
Failed requests:        0
Total transferred:      7888694 bytes
HTML transferred:       6480364 bytes
Requests per second:    68.17 [#/sec] (mean)
Time per request:       14.669 [ms] (mean)
Time per request:       14.669 [ms] (mean, across all concurrent requests)
Transfer rate:          770.04 [Kbytes/sec] received

Connection Times (ms)
              min  mean[+/-sd] median   max
Connect:        0    0   0.0      0       0
Processing:    12   15   2.7     14      39
Waiting:       12   14   2.7     13      39
Total:         12   15   2.7     14      39

Percentage of the requests served within a certain time (ms)
  50%     14
  66%     15
  75%     16
  80%     16
  90%     18
  95%     19
  98%     21
  99%     23
 100%     39 (longest request)
This is meaningful improvement, but still not testing our home page, the page one sees after they punch in their username and password. (When one gets logged in, they are redirected to account/campaigns)
So, if you can temporarily disable all authentication on a page, you might be able to access it locally in an incognito browser.
But every page of our app has a concept of current_user, and the data we display is determined 100% by exactly who is logged in.
Apache Bench provides a few additional flags one can pass in, like:
-A auth-username:password
    Supply BASIC Authentication credentials to the server. The
    username and password are separated by a single : and sent
    on the wire base64 encoded. The string is sent regardless
    of whether the server needs it (i.e., has sent an 401
    authentication needed).
This isn’t sufficient for a Rails app, though. This could work on a website that has a pop-up requiring username/password (maybe?) but not for modern web applications.
Fortunately, once someone is logged into a Rails app, the app keeps track of that login via cookies. Here’s another flag ab provides:
-C cookie-name=value
    Add a Cookie: line to the request. The argument is typically
    in the form of a name=value pair. This field is repeatable.
I found an article by Steve Grossi, where he said:
But you’re (hopefully) using more sophisticated, session-based authentication, especially with a Rails app. In this case, you’ll just need to give Apache Bench an authenticated cookie to use on your behalf. I’m sure there’s an easier way to do this with cURL, but I find it simplest to use Chrome developer tools to inspect the cookie header sent after I log in.
I can work with this.
Apache Bench and cookie-based authentication #
Per Steve Grossi’s instructions, we first have to find just the relevant cookies for logging in.
Another helpful page said
- Open the site to test in the browser of your choice. Do not login yet.
- In order to see which cookies are really necessary, delete all cookies, reload the page, log into the site and reload the cookie information site. For Rails powered sites, you should see a cookie named
_your_site_sessionand – depending on your authentication solution – something likeremember_token.
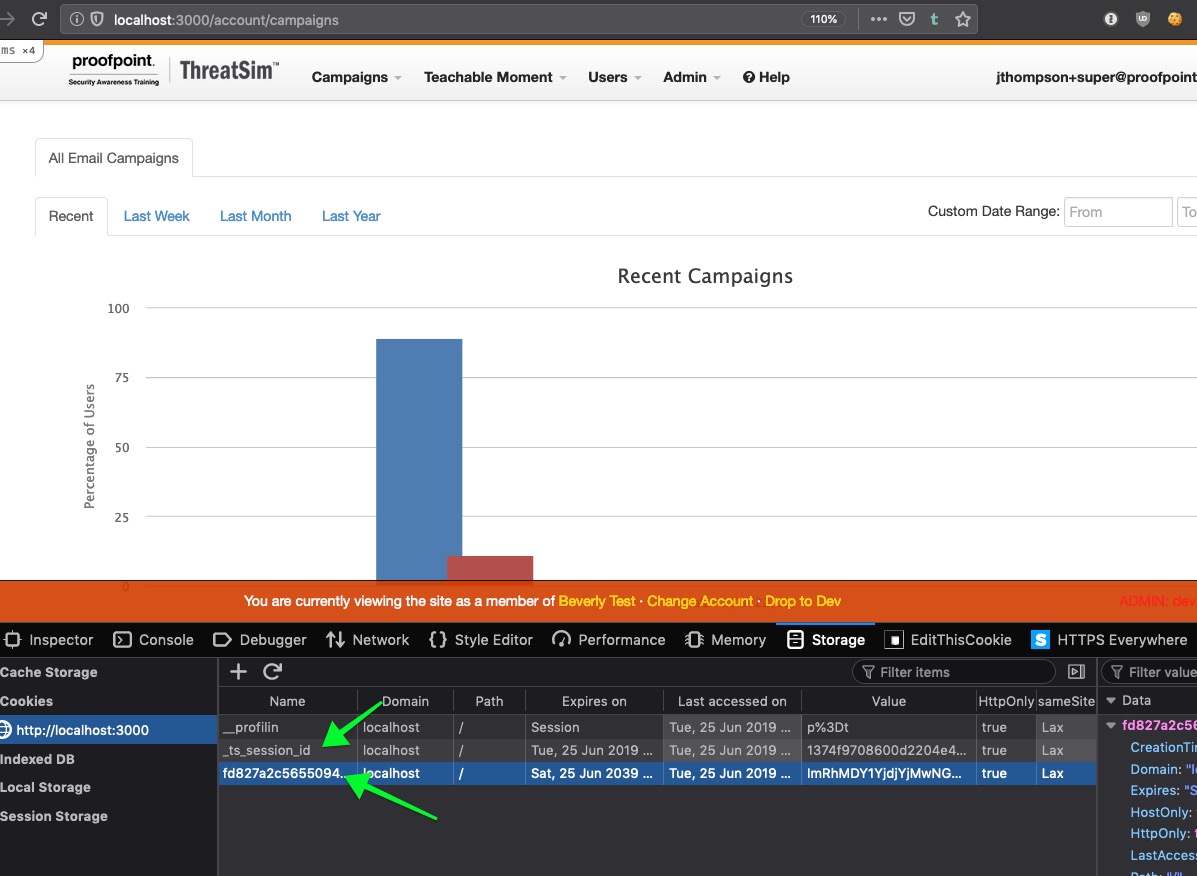
So, with these cookies, lets build up a new-and-improved Apache Bench request:
$ ab -t 1 -C '_ts_session_id=<cookie_1>;fd827a2c56550=<cookie_2>' http://127.0.0.1:3000/account/campaigns
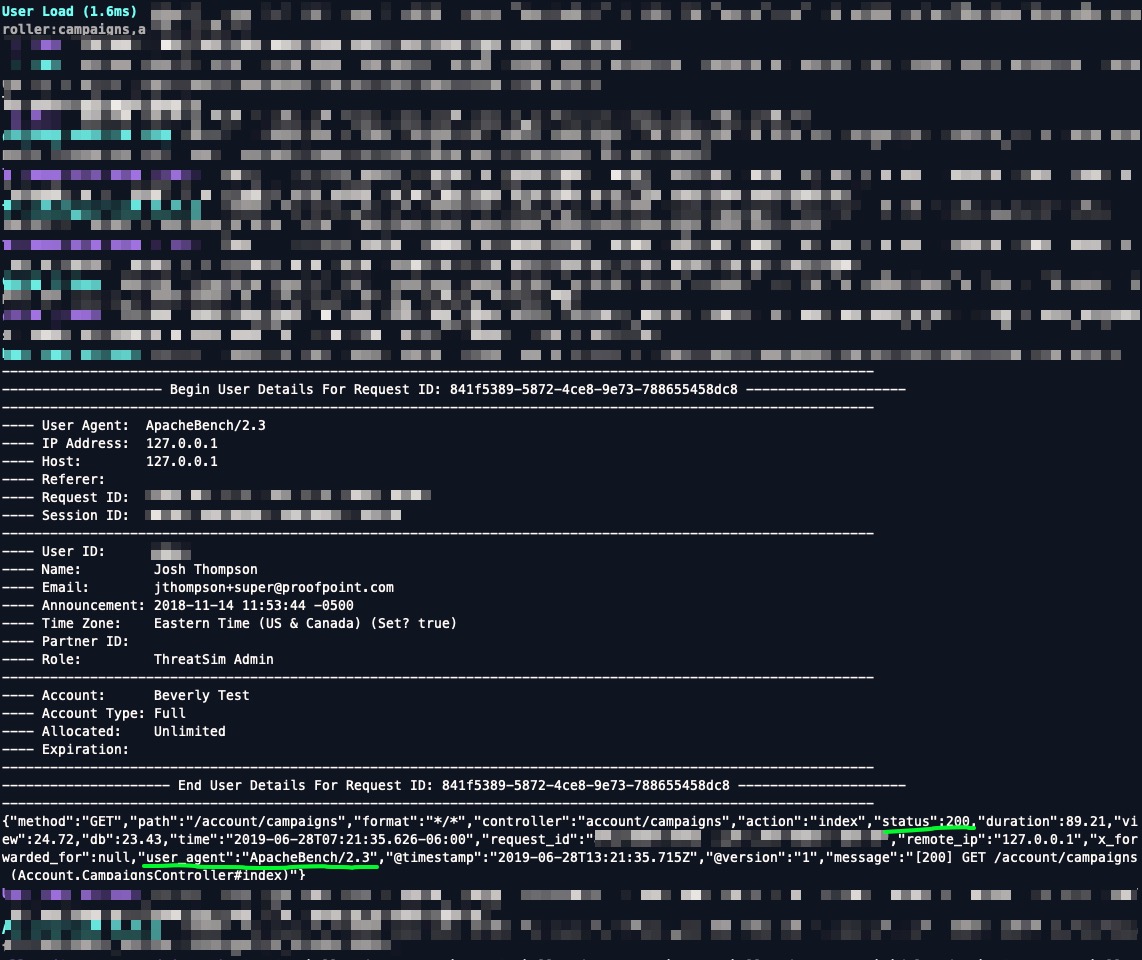
Validating Apache Bench’s cookie-based authentication in logs/development.log #
Hah! This works. I can validate this a few different ways; for example, tail -f logs/development.log prints lots of user details for the user corresponding to this cookie:
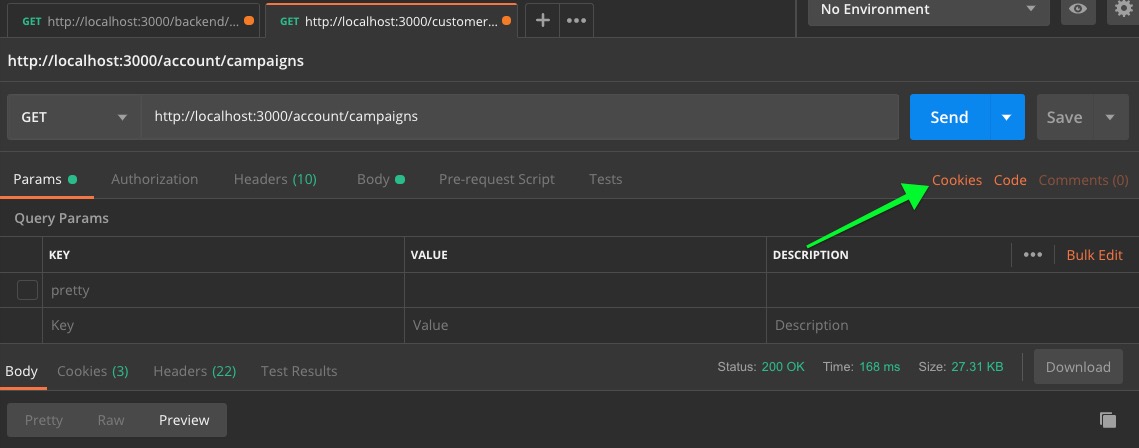
Just for fun, I wanted to re-create this in Postman, to make sure the cookies are working and the page is getting loaded up.
Validating Apache Bench’s cookie-based authentication in Postman #
Fire up Postman, and head to the Cookies tab:
Next, add the domain name for the cookie. Note that it must be just the domain; no www, no com, no port number.
localhost(good)http://localhost(bad)localhost:3000(bad)
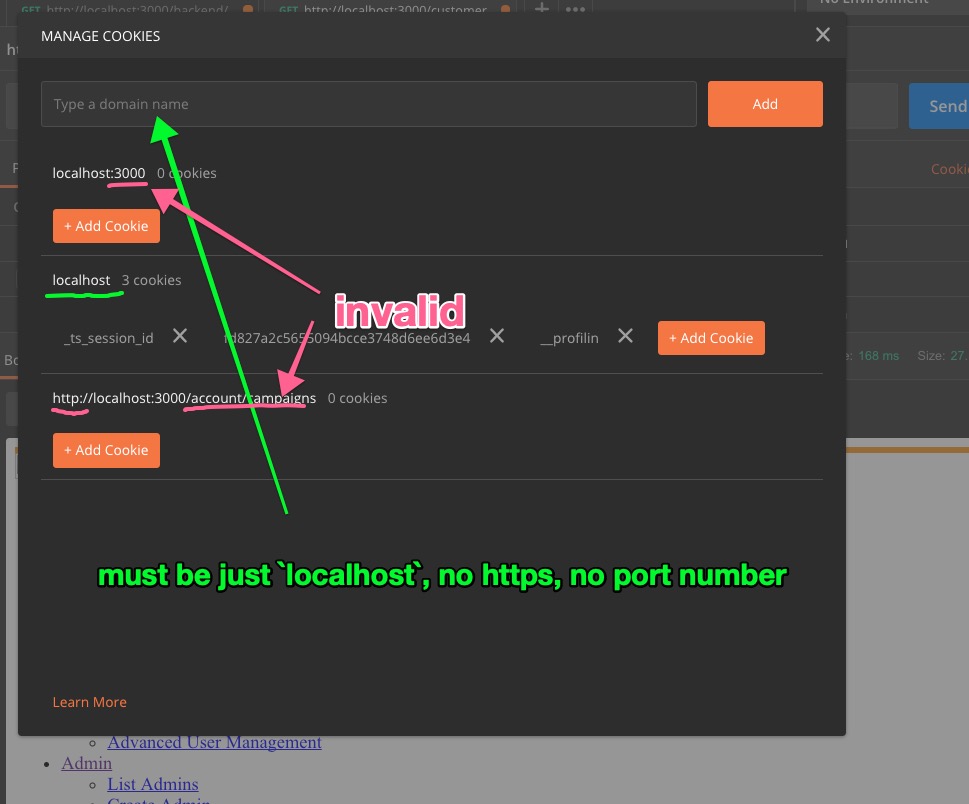
And, if everything works, you can now make a GET to a resource that would normally return a login page!
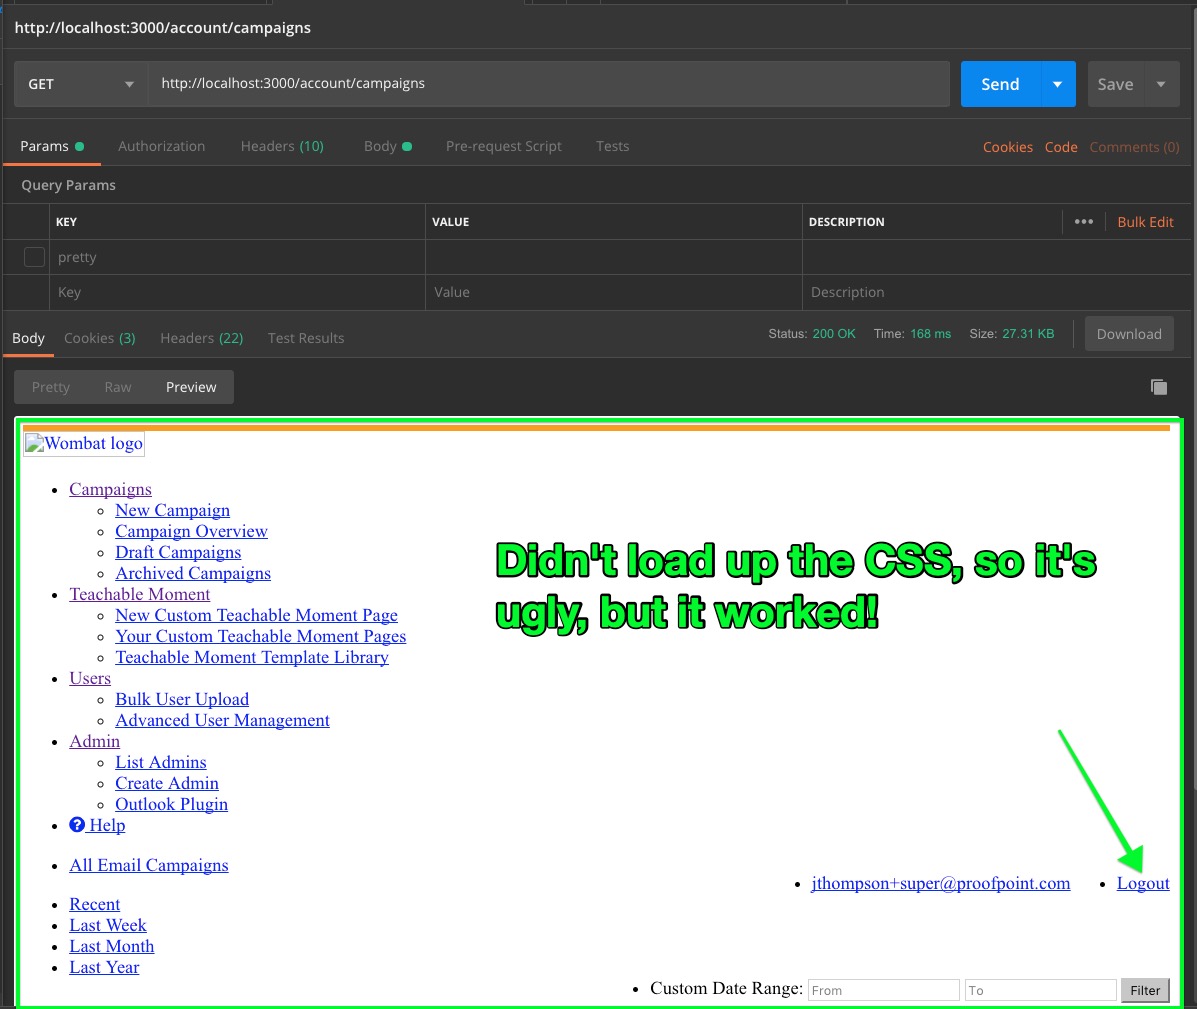
Lastly, here’s the output from AB with cookie auth, against account/campaigns:
$ ab -t 10 -C '_ts_session_id=<cookie_1>;fd827a2c56550=<cookie_2>' http://127.0.0.1:3000/account/campaigns

Benchmarking 127.0.0.1 (be patient)
Finished 93 requests


Server Software:
Server Hostname:        127.0.0.1
Server Port:            3000

Document Path:          /account/campaigns
Document Length:        24381 bytes

Concurrency Level:      1
Time taken for tests:   10.057 seconds
Complete requests:      93
Failed requests:        0
Total transferred:      2446086 bytes
HTML transferred:       2267433 bytes
Requests per second:    9.25 [#/sec] (mean)
Time per request:       108.136 [ms] (mean)
Time per request:       108.136 [ms] (mean, across all concurrent requests)
Transfer rate:          237.53 [Kbytes/sec] received

Connection Times (ms)
              min  mean[+/-sd] median   max
Connect:        0    0   0.0      0       0
Processing:    86  108 107.2     94    1112
Waiting:       86  108 107.2     94    1112
Total:         86  108 107.2     94    1113

Percentage of the requests served within a certain time (ms)
  50%     94
  66%     95
  75%     97
  80%     99
  90%    106
  95%    117
  98%    279
  99%   1113
 100%   1113 (longest request)
Next up will be using siege to visit dozens of subsequent pages on the app. And some Datadog goodies. At that point, I think we’ll be ready to start making comparative judgements across pages, speeds, and we’ll be able to start making intelligent decisions about how to speed up the app.