The How and Why of BlockValue
Article Table of Contents
I wrote the following post, and built the application in question, in 2017, in my “end of Turing” project, before I’d ever been hired as a software developer.
I really enjoyed the app that I built, and I keep wanting to get around to cleaning it up and making it work again. Maybe sometime soon!
I’ve been sketching out an app that “crowdsources” GIS data.
According to Wikipedia,
A geographic information system (GIS) is a system designed to capture, store, manipulate, analyze, manage, and present spatial or geographic data.
My inspiration is Hoodmaps, which @levelsio kindly wrote an in-depth post about.
Armed with a solid example for something that I thought I could work with, I got to work.
The problem #
In general, property delivers value to people by doing something. It can do all sorts of things, but my first pass was to try to figure out the relationship between buildings and parking lots. Eventually I realized I needed to be able to “tag”:
- parking lots
- buildings
- green space (useful)
- legally required but otherwise useless green space (building setbacks)
- streets
and maybe more some day.
I’ve got a working hypothesis that we’ve built our cities based off of some insane rules, one of which being “lets put surface parking lots everywhere.”
I contend that a surface parking lot close to an economically productive stretch of property (like a walkable downtown) is a very poor use of resources.
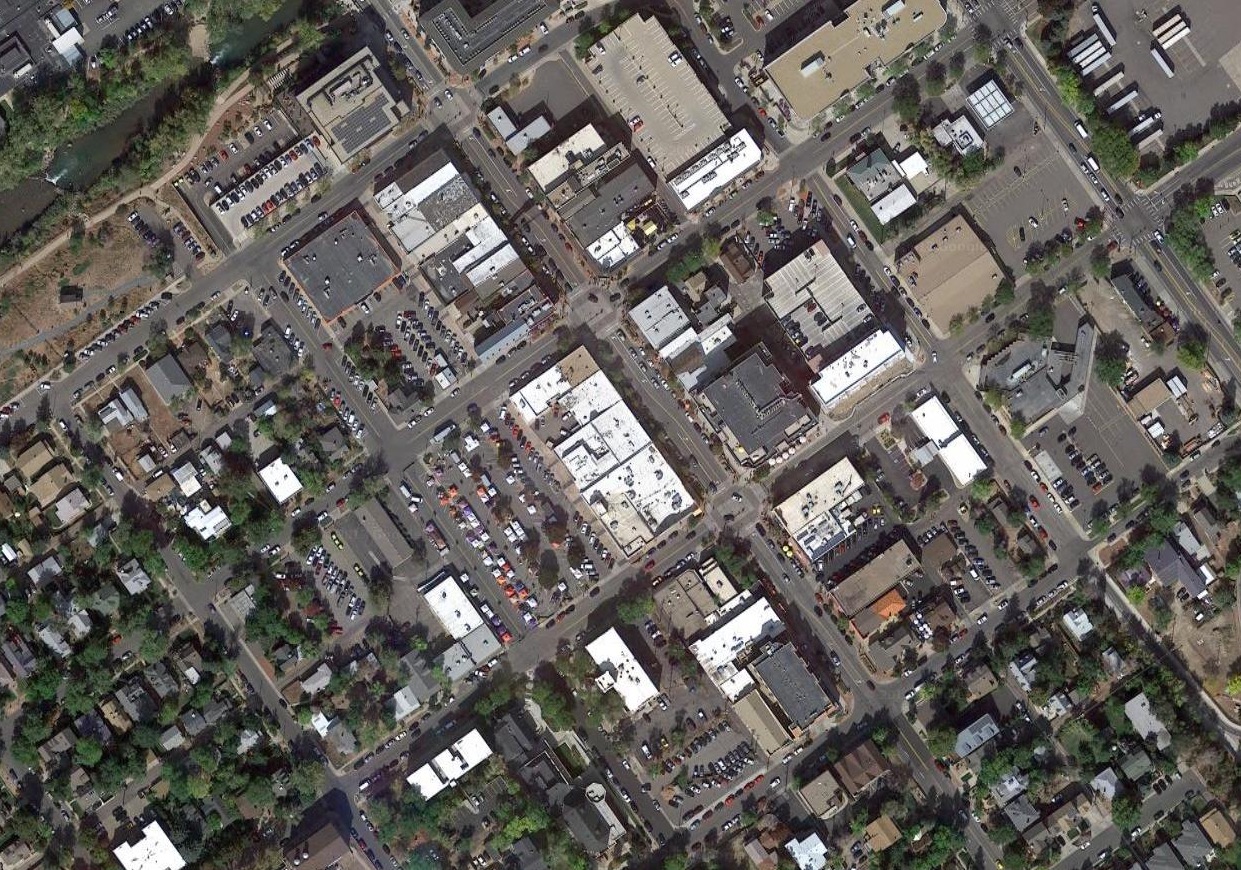
Lets look at a quick example from my home town, Golden, CO:

Hm. Doesn’t reveal too much, does it?
Maybe it would be nice if we could color-code the map by land use?
The solution #
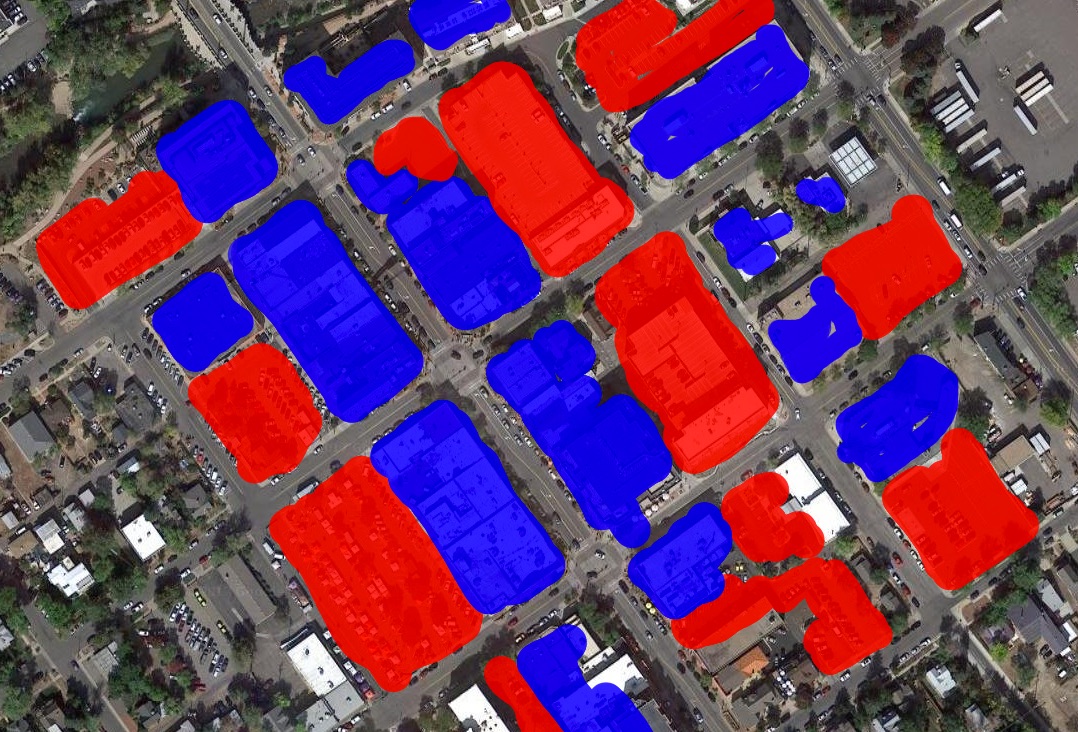
Lets take another look, through the lens of crowd-sourced GIS data:

Red is parking lots, blue is buildings. This is downtown Golden, or almost everything that everyone loves about downtown is blue, and the red stuff is (again, just my opinion) counter-productive.
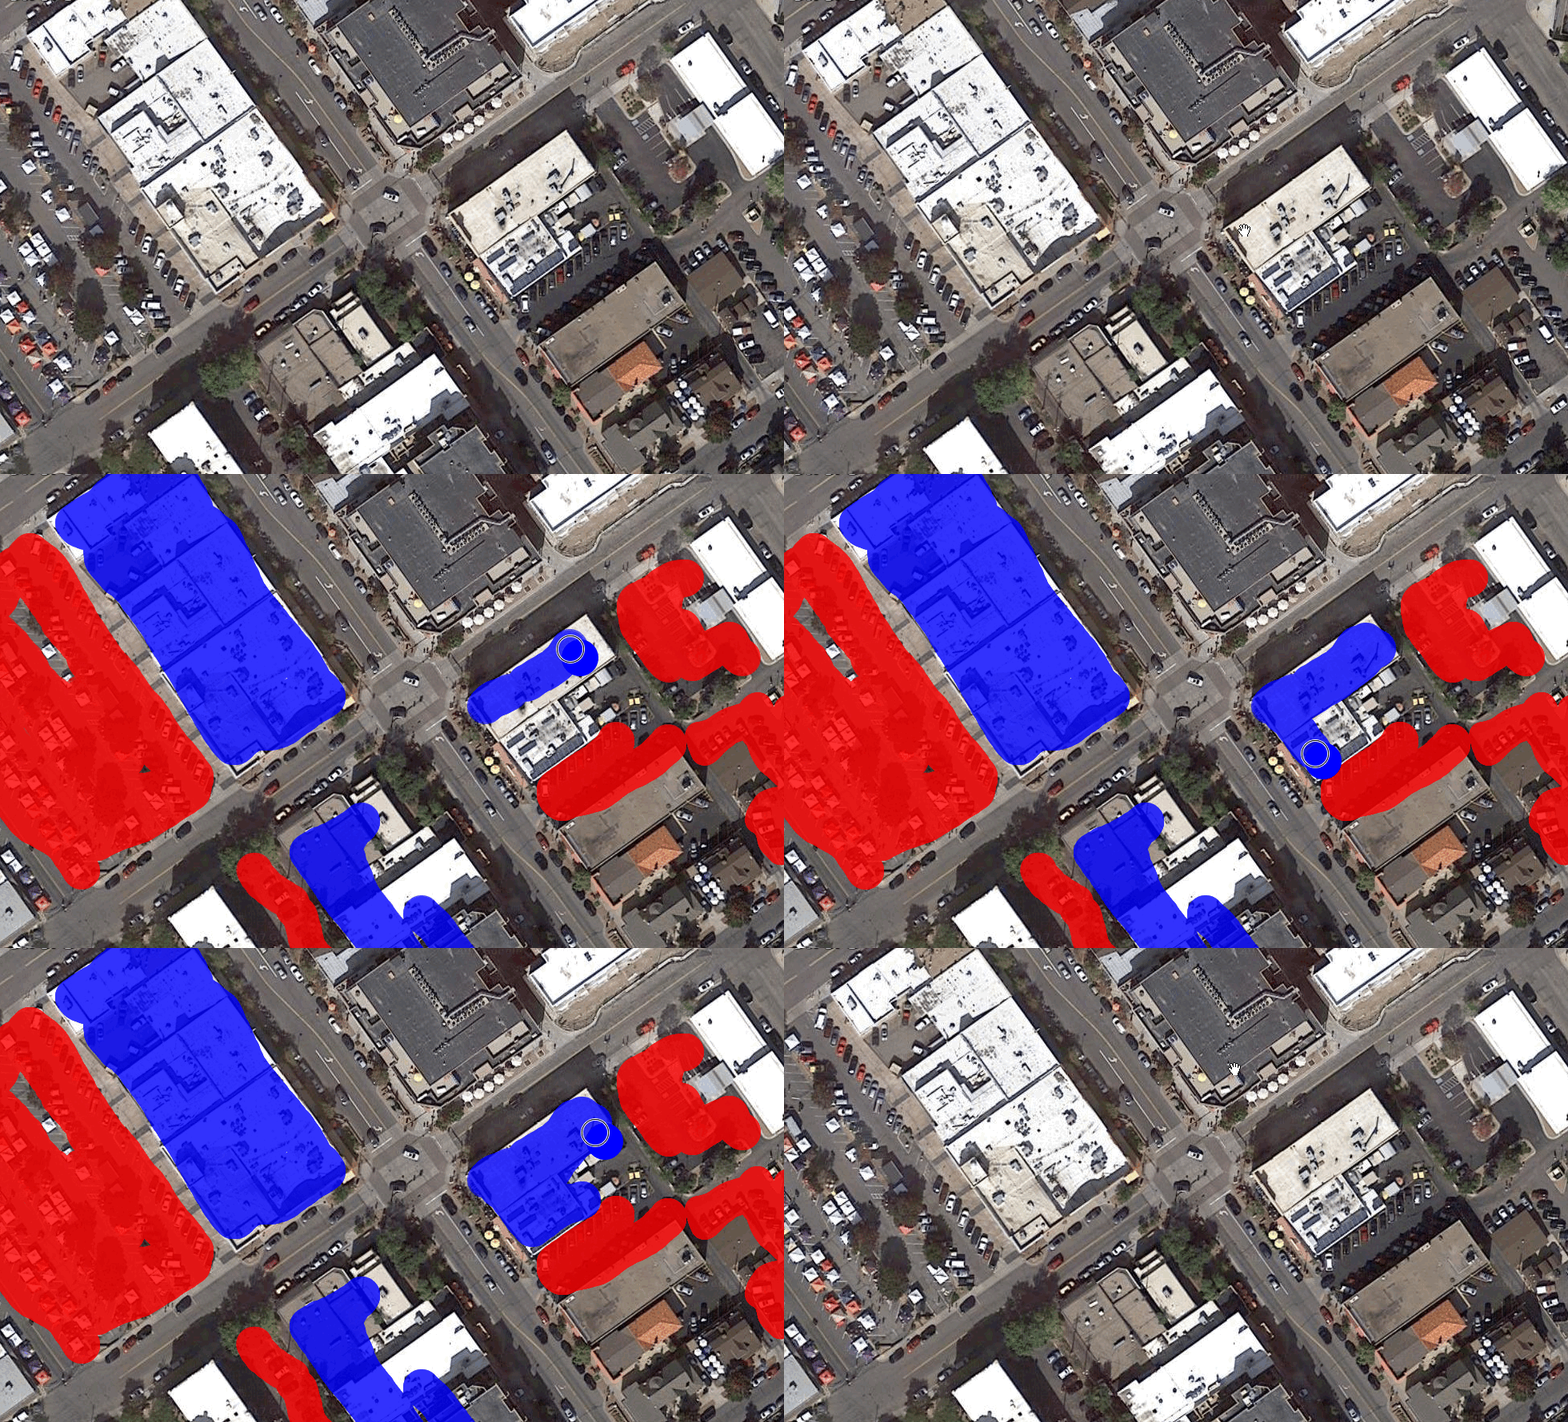
The concept of this app is dead-simple. Almost paint-by-numbers so.
It’s still a bit clunky to use, but here’s the gist:

The technology #
It’s a pretty simple tech stack, but the devil is in the details.
On the front-end, I’ve got a transparent HTML5 canvas overlaid on a Google Maps satellite layer.
To draw on the map, the user is just painting on the HTML5 canvas.
That was the easy point. Harder is the fact that I have to store this user data, which is coming from the HTML5 canvas as just X and Y coordinates relative to the edge of the screen.
Fortunately, StackOverflow to the rescue. I got two functions to convert a Lat/Long coordinates to a point on a map, and back again.
// convert position on map to coordinates
function latLng2Point(latLng, map) {
  var topRight = map.getProjection().fromLatLngToPoint(map.getBounds().getNorthEast());
  var bottomLeft = map.getProjection().fromLatLngToPoint(map.getBounds().getSouthWest());
  var scale = Math.pow(2, map.getZoom());
  var worldPoint = map.getProjection().fromLatLngToPoint(latLng);
  return new google.maps.Point((worldPoint.x - bottomLeft.x) * scale, (worldPoint.y - topRight.y) * scale);
}

function point2LatLng(point, map) {
  var topRight = map.getProjection().fromLatLngToPoint(map.getBounds().getNorthEast());
  var bottomLeft = map.getProjection().fromLatLngToPoint(map.getBounds().getSouthWest());
  var scale = Math.pow(2, map.getZoom());
  var worldPoint = new google.maps.Point(point.x / scale + bottomLeft.x, point.y / scale + topRight.y);
  return map.getProjection().fromPointToLatLng(worldPoint);
}
A bit of tweaking got those working for my drawUserPaths and drawSh*t functions.
Every time the user draws a path, an AJAX call fires, sendingUserPaths (these are the user data containing the color, size, and location of what the user is drawing) to my server.
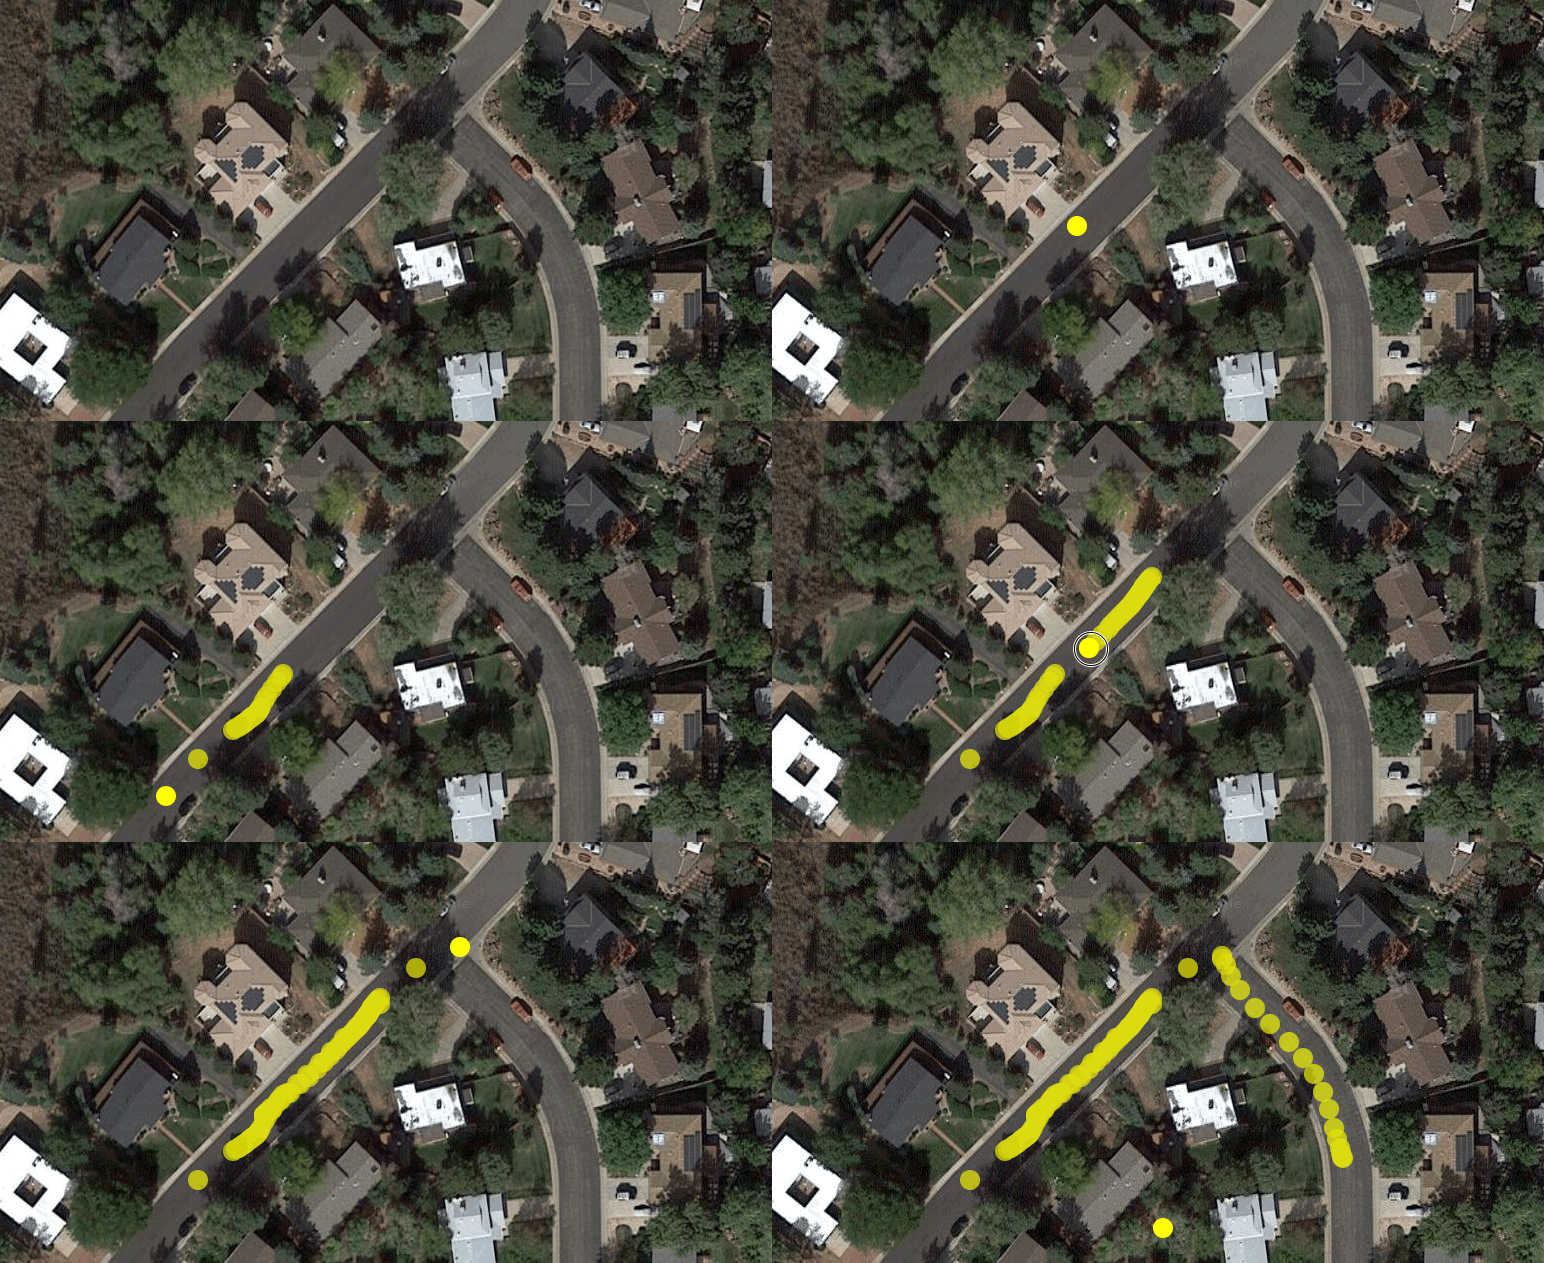
It’s hard to draw closed paths on top of HTML5 canvas. These screenshots make it look like someone is drawing a continuous line, but there’s not. Here’s what a quick mouse movement looks like:

Here’s my “draw stuff” function:
function drawPath() {
  if(!mouseDown) return;
  ctx.width = window.innerWidth
  ctx.height = window.innerHeight
  ctx.fillStyle = currentColor
  ctx.strokeStyle = currentColor
  ctx.lineWidth = brushSize
  var offsetX = event.offsetX
  var offsetY = event.offsetY

  var isDrawing, points = []
  points.push({x: offsetX, y: offsetY, category})
  ctx.clearRect(0,0, 5, 5)

  ctx.beginPath();
  ctx.moveTo(points[0].x, points[0].y)
  for (var i = 0; i < points.length; i++) {
    ctx.lineTo(points[i].x, points[i].y)
  }

  ctx.stroke();
  point = []
  point.x = offsetX
  point.y = offsetY
  var positionOnMap = point2LatLng(point, map)

  var category=$('.color-picker div.active').data('category')
  var lat = positionOnMap.lat()
  var lng = positionOnMap.lng()
  var time = Date.now()
  var sizeRatio = brushSize / map.zoom
  userPaths.push(
      {
        coords: [lat, lng],
        category: category,
        time: time,
        user_id: userId,
        size_ratio: sizeRatio,
        line_count: lineCount
      }
    )
}
The “business” is the ctx.beginPath() and ctx.stroke() portions. HTML5 seems to think well in points, not in “paths”. So, if I want to be able to draw a continuous path, there’s some very tricky business around connecting many points. I left that for a later day, so for now - everyone is drawing overlapping circles. Bleh.
When the user moves the map, another AJAX calls fires, retrieving the server data.
(There are some hefty problems in this process. I’ll get to the “what’s next” below)
The data’s stored in a standard PostGres Database. Watching the logs when others were using it was fun:
TFW people are using your app b/c it looks like Postgres is blowing up. 😱 pic.twitter.com/XBPV73uuim
— Josh Thompson (@josh_works) August 3, 2017
The challenges #
I’d not done much with JavaScript or AJAX calls before this project.
Most of my time was spent wrestling with the HTML5 canvas overlay, getting it to play correctly with the Google Maps layer underneath.
When a user toggles the “draw” function, I’m just changing the z-index of the canvas to go “below” the google maps layer. I can’t imagine this is best practice, but it is what it is.
It was hard converting x/y data from the canvas to lat/long coordinates to store in the database, and to bring it back out when I need to load up the data.
There were lots of challenges, but it’s been very educational!
What’s next #
I desperately need to set up caching all over the place, and localize the data that I return in my database to contain only about what is visible on the screen.
There’s a few UI tweaks I need to get in place, too. It’s hard to move between drawing and moving the map.
Finally, I’d like to be able to “do math” against the colored portions of the screen. To say “50% of the visible region is parking lot” or something like that. Then I can start comparing it against popular urban areas in other cities, and other countries.
I think this stage will be when the real value is visible.