Tour of D3 for Clueless Folk Like Me
Article Table of Contents
D3 stands for Data Driven Documents, and it’s the coolest thing ever.
Check out a few examples:
- Animated, interactive curves(dynamic)
- OMG Particles II(dynamic)
- simple map of the us(static) <= very little code
- Radial Dendrogram(static)
- circle wave(dynamic)
- Force-directed tree(dynamic) <= super cool
So, this is the kind of stuff you can do with D3. The Front-end track at Turing gave a short lesson on D3, and I was one of two back-end folks participating. This was actually really encouraging, because they didn’t know much about d3 either.
So, lets dig into D3 a bit, and do two things:
- Get a running d3 map running locally (we’re gonna use circle wave)
- Deconstruct a simple d3 project to it’s minimum components, expecting that we’ll learn something along the way.
Note to the reader: I know _almost nothing about frontend tools. If you’re comfortable on the front-end, bear with my ignorance. If you, too, know nothing about the front-end, great! This should be at your level._
Running circle-wave locally #
- you’ll need a text editor and a browser. I’m using Chrome and Atom.
- you’ll need to be able to open up various files on your computer in Chrome and your text editor. My tool of choice is the command line + iterm + zsh.
First, have a folder you can stick this all in. I’ve got /d3/circle-wave/
Next, open up the circle wave project.
See where it says “index.html” on the page, followed by the code?
Copy and paste all that into index.html.
Save the file, and open it in chrome. open -a "Google Chrome" index.html or open index.html, run from the folder holding the file, should get it opened up for you. If it’s opening it in finder or something, google around to figure out what works for you.
At this point, you should have opened up the file on your machine. You’ll know this because the URL is something like file:///Users/joshthompson/turing/2mod/self_study/d3/circle_wave/index.html, and you should see the circle-wave animation running.
Breaking things #
Lets deconstruct what’s going on a bit. Open up Chrome’s Dev Tools (cmd+shift+i) and look at the code. Tab over to elements, and it should look pretty simple, pretty static.
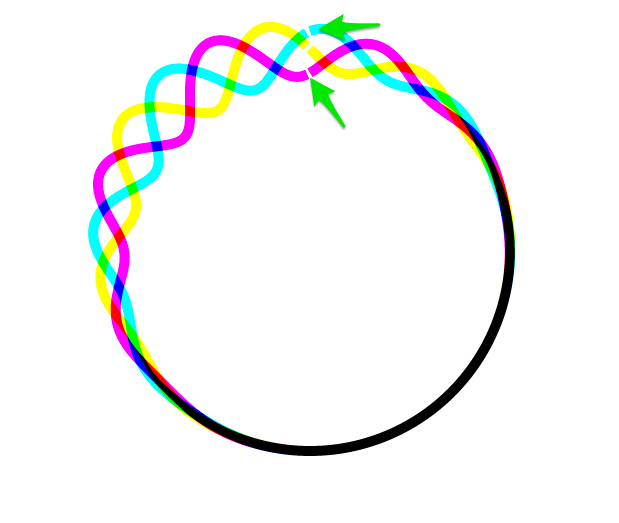
Next, lets inspect just the circle wave itself. Open up the “selection tool” (it’s the mouse icon in a box on the top left side of your dev-tools toolbar. The shortcut is cmd+shft+c and mouseover just the circle itself.
Now it’s a bit strange. You should get a slowly-moving box with rapidly-changing x/y values:
When you click on it, you’ll see the values in your HTML going bananas:
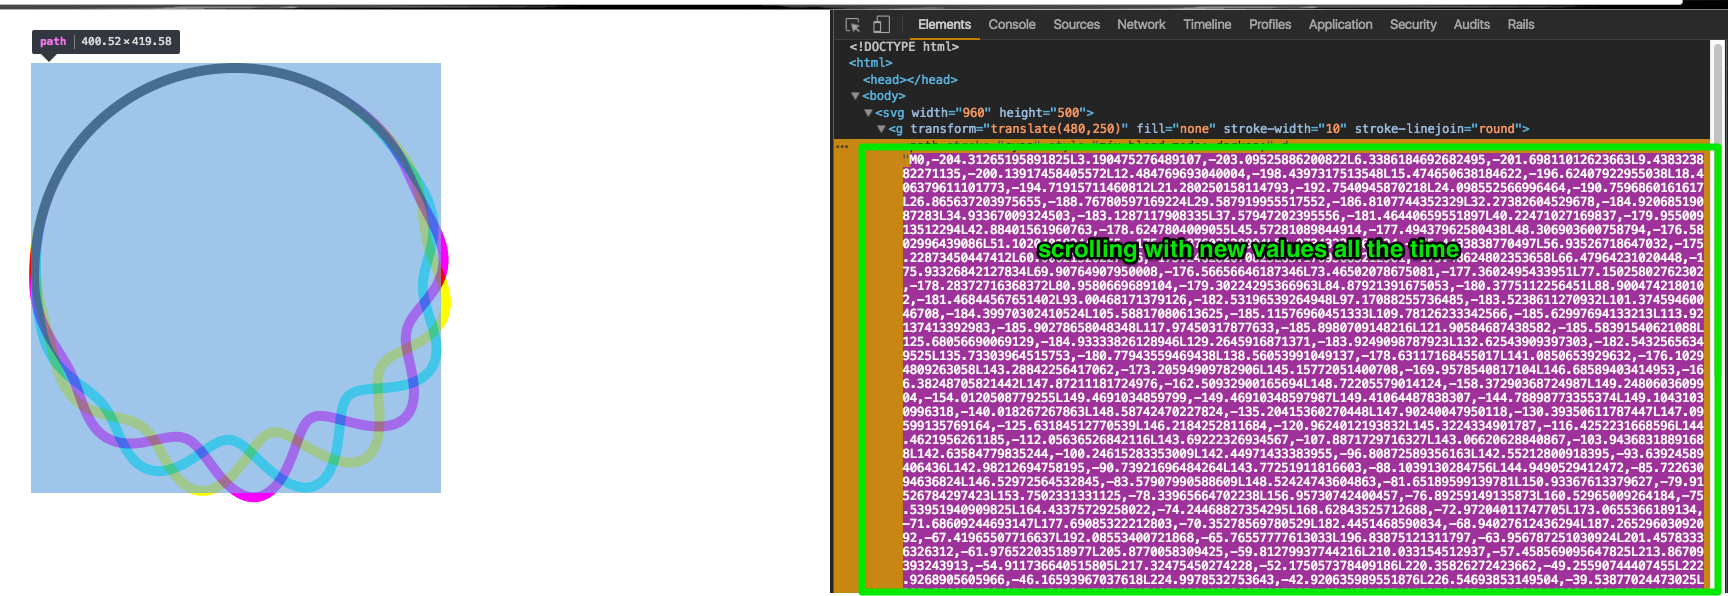
it looks like all that is happening inside of the <path stroke="cyna" style="mix-blend-mode: darken;" d= {crazy values here}
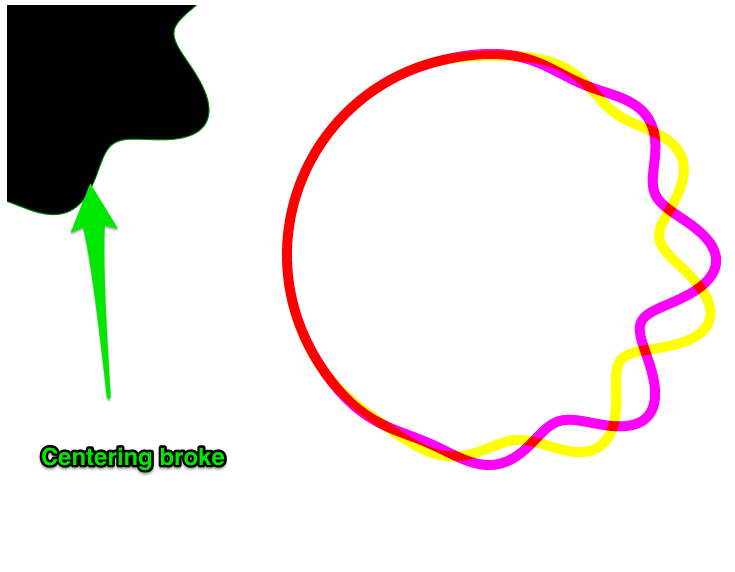
Lets play with these values for a bit. In the browser, double-click on the “cyan” element. (you might not be seeing cyan, but have a different color. it depends on which line you managed to click on above.)
Change it to red, or green, or whatever. When I changed it (a few times) at one point the element got centered way away from everything else, and looked super crazy.
D3 Docs, console, changing values #
Looking through the code, there’s a few things that jump out at me:
var t = d3.now() / 1000;
What’s the .now method on d3? The docs say it just picks the current time value, sorta like Time.now in Ruby.
Popping into the dev tools console, lets try d3.now().
Ah, interesting. values. And in the code, it’s calling d3.now() / 1000;
Looks like that returns a random number between (maybe) 1..100, with many decimal points.
I’m gonna try “hardcoding” the t value in the code I’ve copied into Atom.
When I changed
var t = d3.now() / 1000;
to
var t = 44.328915;
the animation is frozen. It just starts and doesn’t move. So I think d3.now is pulling an always new value for time. This must be what makes the circle move at a consistent pace. (Or I’m totally wrong. who knows)
That makes sense, though. Here’s where that time variable is being used:
.radius(function(a) {
   var t = d3.now() / 1000;
   return 200 + Math.cos(a * 8 - i * 2 * Math.PI / 3 + t) * Math.pow((1 + Math.cos(a - t)) / 2, 3) * 32;
   });
So t is talking to both cos functions.
Digging into that cos function, I looked in the D3 docs, and it doesn’t have a Math module. Turns out that’s just JavaScript. JavaScript’s Math.cos() for the curious.
d3.curveLinearClosed #
return d3.radialLine()
    .curve(d3.curveLinearClosed)
    .angle(function(a) { return a; })
    .radius(function(a) {
      var t = d3.now() / 1000;
      return 200 + Math.cos(a * 8 - i * 2 * Math.PI / 3 + t) * Math.pow((1 + Math.cos(a - t)) / 2, 3) * 32;
    });
That curveLinearClosed is interesting. D3’s docs indicate that curveLinear is also a valid option. Lets try it out.
Makes sense. The docs say the difference between curveLinear and curveLinearClosed is if there’s a line drawn between the first and last element in the line.
the first var block looks interesting:
var svg = d3.select("svg"),
    width = +svg.attr("width"),
    height = +svg.attr("height"),
    angles = d3.range(0, 2 * Math.PI, Math.PI / 200);
I’m curious about that angles value. d3.range(something complicated) gives… what exactly?
Over to the console:
d3.range(0, 2 * Math.PI, Math.PI / 200);
=> Array[400]
Well, what’s in the array?
x.forEach(
    console.log)
(pardon my bad JavaScript syntax. I’ve not done much with it before today…)
And that printed a ton of stuff to the console.
Turns out theres a better way to see what’s in an array. Just click the arrow next to it, and you can open it up.
So, looks like this array is composed of four ranges: [0...99],[100...199],[200...299],[300...399]. Each of those has a bunch more values inside, like:
1: 0.015707963267948967
2: 0.031415926535897934
3: 0.0471238898038469
4: 0.06283185307179587
5: 0.07853981633974483
6: 0.0942477796076938
7: 0.10995574287564278
8: 0.12566370614359174
Crazy. There’s some mad mathing going on in here.
OK, in svg.append("g"), that’s how D3 talks to (or about) SVGs. it’s “Grouping”, I believe.
Lets see how much we can delete and still have something working: