Setting up Application Performance Monitoring in DataDog in your Rails App
Article Table of Contents
When I write guides to things, I write them first and foremost for myself, and I tend to work through things in excruciating detail. You might find this to be a little too in-depth, or you might appreciate the detail. Either way, if you want a step-by-step guide, this should do it.
As mentioned in Load Testing your app with Siege, I want to get Application Performance Monitoring in place for our app. We use Rails.
To someone who doesn’t know much about this space, there was more friction than I expected.
I’ll wander around, get everything set up, and outline any places that I bump into stuff.
First, DataDog has a handy video about how to configure your app to use APM:
https://docs.datadoghq.com/videos/rails/
Unfortunately, the link they give in the video to https://app.datadoghq.com/apm/docs redirects to https://app.datadoghq.com/apm/intro, which fails to tell you how to find the actual docs. 🙄
So, I found https://docs.datadoghq.com/tracing/, which don’t look anything like what’s in the video. Docs go out of date, this isn’t a problem.
It looks like the setup involves a few steps:
- Enable Trace collection in the Datadog Agent
- Instrument your application to send traces to your Datadog Agent
- Enable Trace Search & Analytics
- Enrich tracing
I don’t know that we’ll get to step 4, but 1-3 look great.
Enable Trace collection in the Datadog Agent #
There’s a lot of complexity boiled into this short little paragraph:
Install and configure the latest Datadog Agent. (On macOS, install and run the Trace Agent in addition to the Datadog Agent. See the macOS Trace Agent documentation for more information). APM is enabled by default in Agent 6, however there are additional configurations to be set in a containerized environment including setting
apm_non_local_traffic: true. To get an overview of all the possible settings for APM including setting up APM in containerized environments such as Docker or Kubernetes, get started Sending traces to Datadog.
Surely I’m not the only person that finds this to be a bit complex, but the whole point of this blog post is to sort all this out.
We’ll break this single step into its actual component sub-steps, as appropriate for a “standard” Rails app.
Install and configure the latest Datadog Agent #
So, hopping over to the link for the latest Datadog Agent, my first thought is why the heck is this about Python? Their docs link to the python section of the docs, not an overview of a list of available languages.
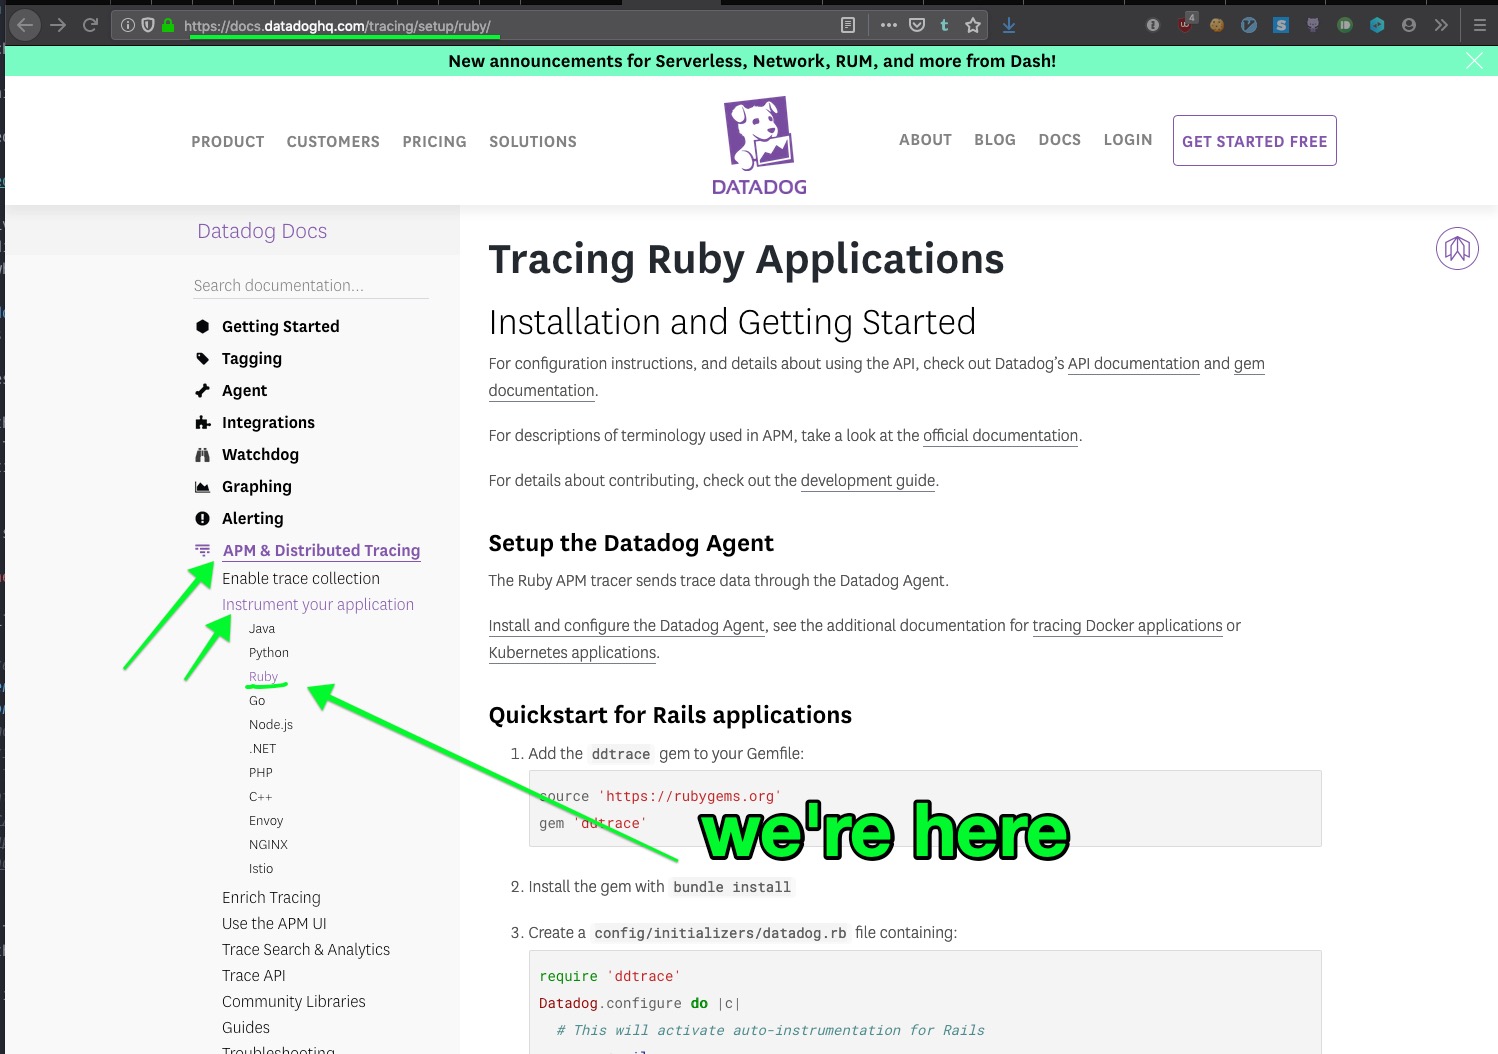
The Ruby setup is here: https://docs.datadoghq.com/tracing/setup/ruby/
So, we’re here:
It’s about now that I’m wondering what is the “DataDog Agent”.
The docs say:
The Datadog Agent is software that runs on your hosts. It collects events and metrics from hosts and sends them to Datadog, where you can analyze your monitoring and performance data.
On the ruby setup page, it says:
The Ruby APM tracer sends trace data through the Datadog Agent.
That… sorta answers the question. I’m not sure where I would install it. It says it “runs on your hosts”, so… I guess I have to get this on our hosts somewhere?
We’ll proceed through the setup. Sigh. I really don’t like these docs. They’re self-referential, and not helping me build a mental model of what I’m trying to do. So we’ll keep blindly pushing along.
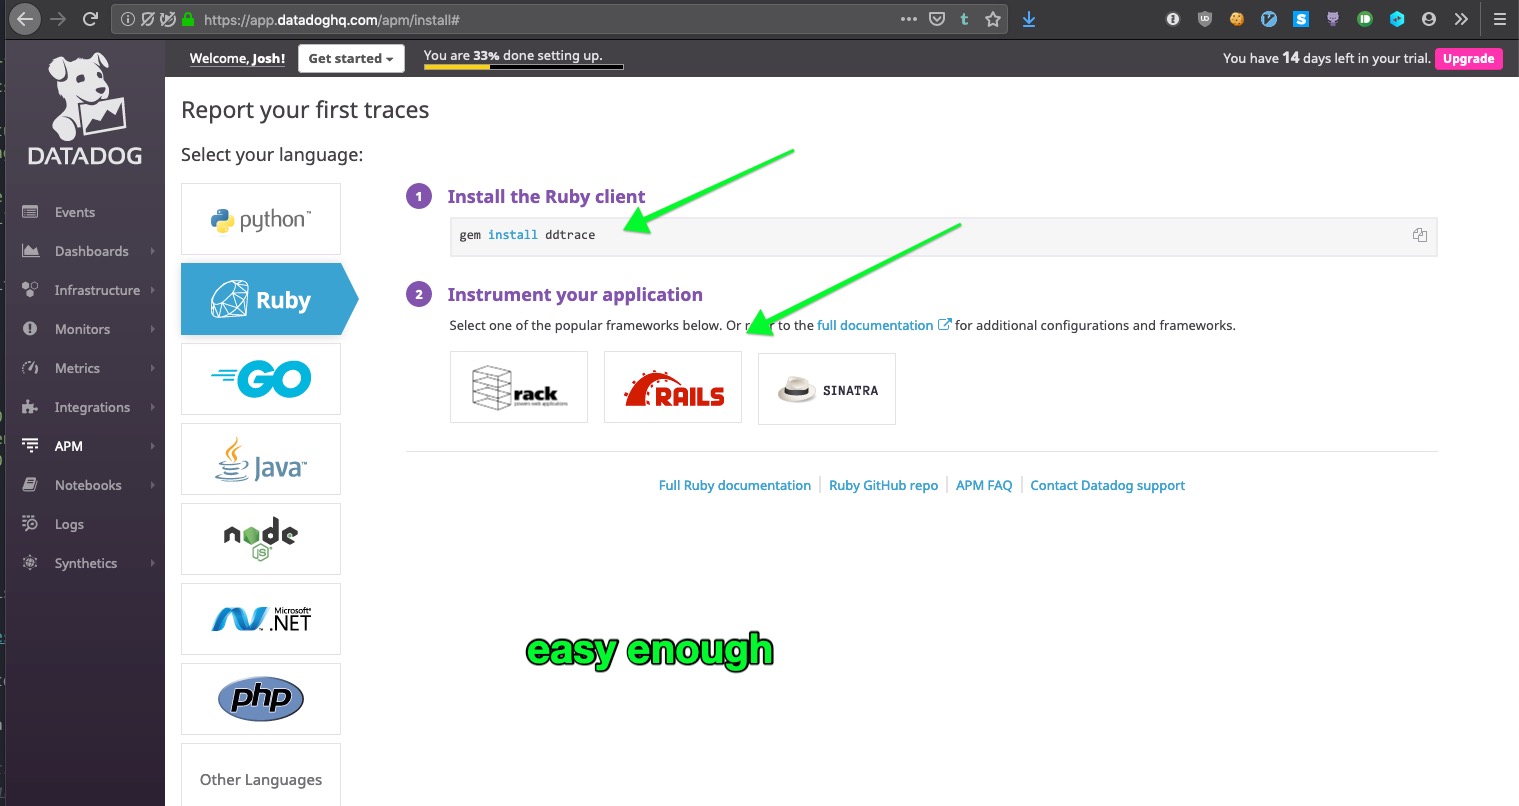
Add the ddtrace gem to your Gemfile #
We already have dogstatsd-ruby in the Gemfile, which is also a datadog gem. Oh well. Onward.
bundle install and create the specified config file:
# config/initializers/datadog.rb
require 'ddtrace'
Datadog.configure do |c|
  # This will activate auto-instrumentation for Rails
  c.use :rails
end
Wooow. That’s the end of this section. The docs say:
After setting up, your services will appear on the APM services page within a few minutes. Learn more about using the APM UI.
So, I assume this means after I deploy our app with the updated configuration.
The link to the APM services page is app.datadoghq.com/apm/services, but the URL redirects to app.datadoghq.com/apm/intro, which tells me nothing about next steps. It looks like a marketing page without a clickable CTA or next-step.
We’re obviously not just going to blindly deploy this in our next release, so this would be an excellent spot to know about sandboxing options, or test/demo modes, etc.
I’m pausing this guide here to send an email to their support team.
I sent:
… So, can you help me figure out next steps? Is there a sort of sandboxed environment, or rate-limited environment, where I can prove that this is useful/valuable, or build some dashboards for my higher-ups to see and understand the value of datadog?
They replied:
… Regarding conducting testing in a sandboxed environment, this can achieve by opening up a new, free trial account. Details are here: https://www.datadoghq.com/free-datadog-trial/
Once you have conducted the necessary tests and are done using the account, you can reach out to support to close the account if you’d like.
So, this is the path I’m going!
I went to the given URL, created a new account, and am working through their onboarding now:
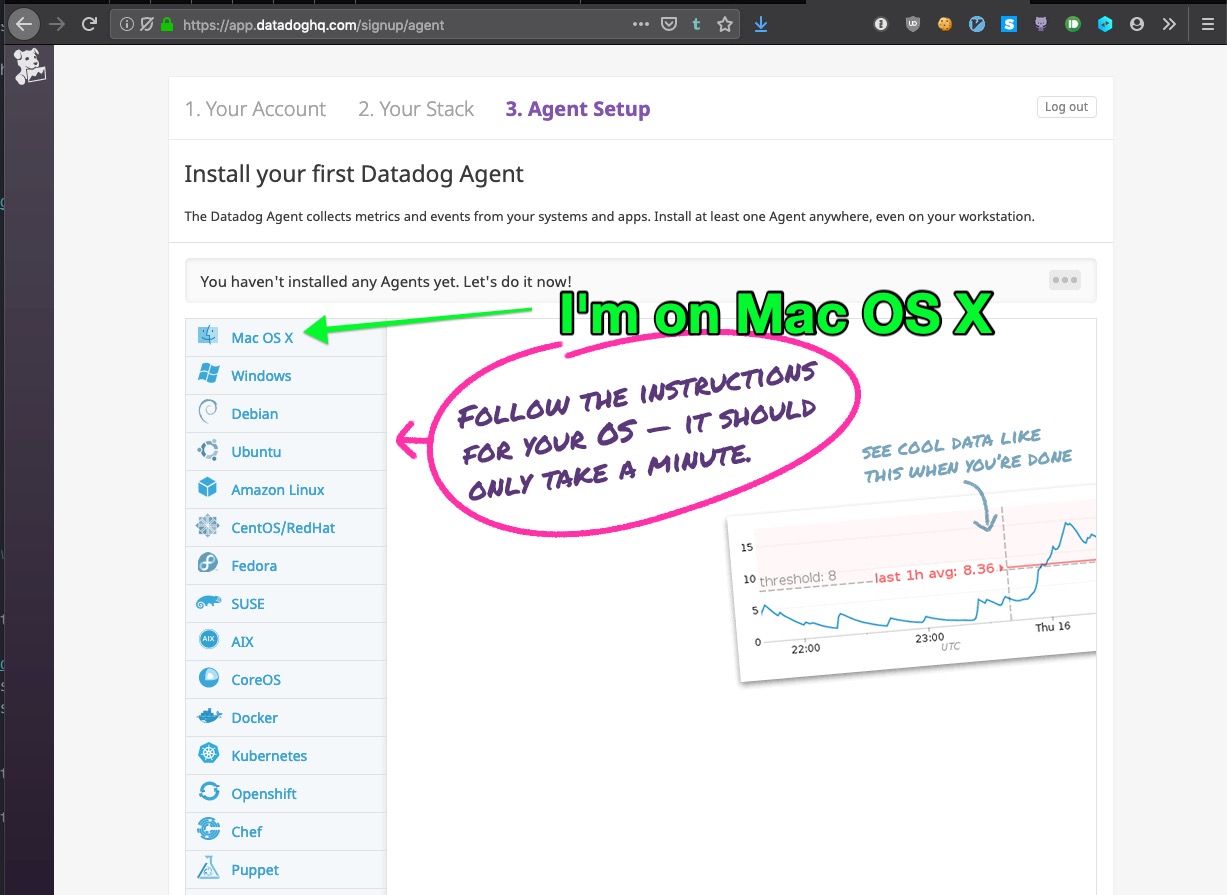
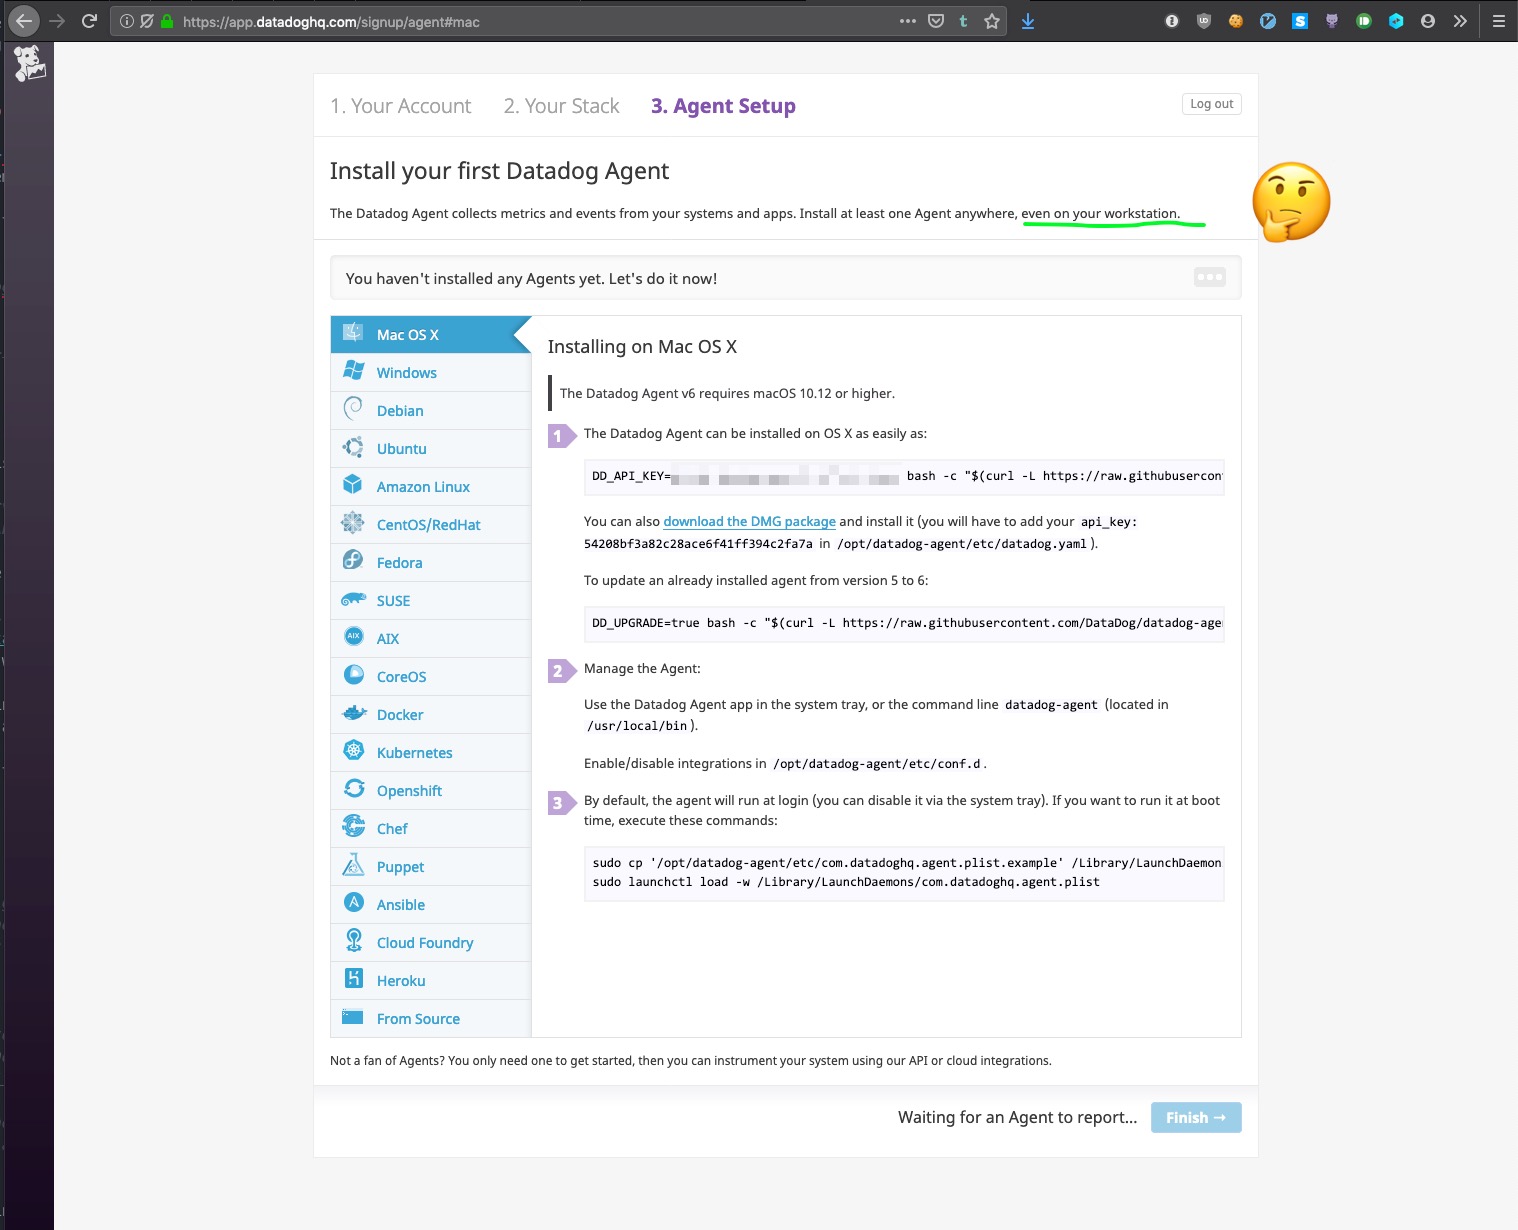
When I click Mac OS X, I’m given a bash command to download and install the Datadog Agent.
I wish they better explained the even on your workstation bit meant. I don’t want to start sending tons of data from my laptop to Datadog; I trust them that this isn’t a keylogger, but still. I like knowing what I’m doing.
Oh well. Onward!
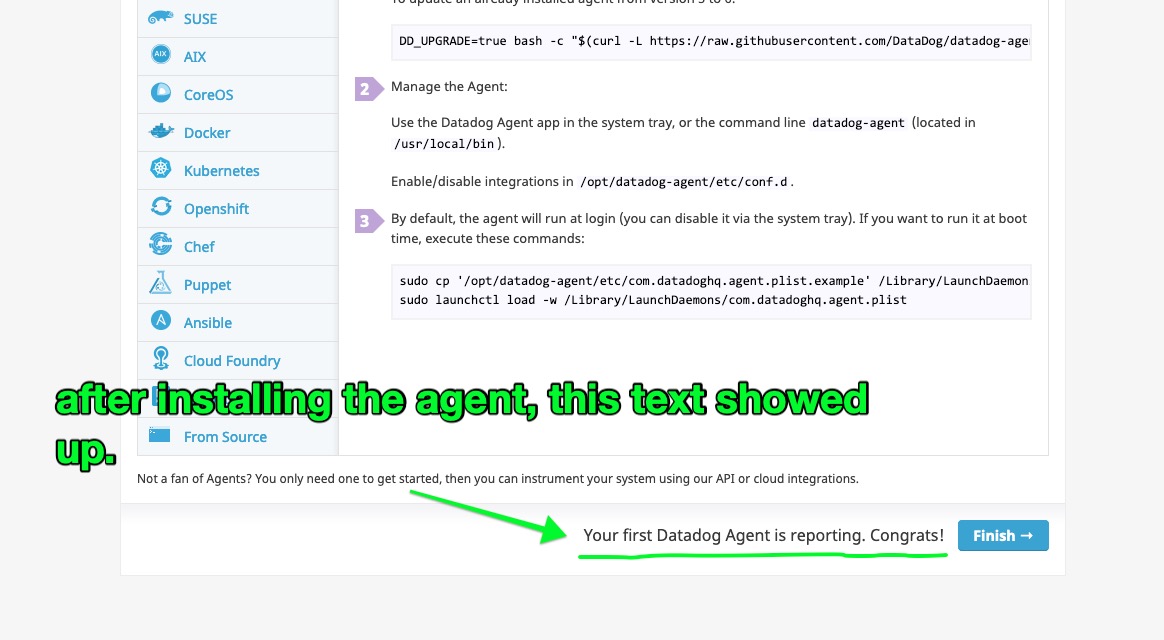
I ran the install command:
$ DD_API_KEY=aaaaa bash -c "$(curl -L https://raw.githubusercontent.com/DataDog/datadog-agent/master/cmd/agent/install_mac_os.sh)"

% Total    % Received % Xferd  Average Speed   Time    Time     Time  Current
                               Dload  Upload   Total   Spent    Left  Speed
100  4974  100  4974    0     0  23554      0 --:--:-- --:--:-- --:--:-- 23573

* Downloading datadog-agent
######################################################################## 100.0%

* Installing datadog-agent, you might be asked for your sudo password...
Password:

  - Mounting the DMG installer...

  - Unpacking and copying files (this usually takes about a minute) ...

  - Unmounting the DMG installer ...

* Restarting the Agent...


Your Agent is running properly. It will continue to run in the
background and submit metrics to Datadog.

You can check the agent status using the "datadog-agent status" command
or by opening the webui using the "datadog-agent launch-gui" command.

If you ever want to stop the Agent, please use the Datadog Agent App or
the launchctl command. It will start automatically at login.
and sure enough, I can see it running now:
$ ps aux | grep datadog
.
.
joshthompson     91147   0.0  0.1  4408076  14024   ??  S     2:21PM   0:00.16 /opt/datadog-agent/embedded/bin/trace-agent -config=/opt/datadog-agent/etc/datadog.yaml
joshthompson     91135   0.0  0.4  4481160  58976   ??  S     2:21PM   0:04.13 /opt/datadog-agent/bin/agent/agent run
And we now have the program datadog-agent available in our shell. Cool.
Oh, and even more. Datadog is getting info from the agent:
I’ll click the finish button, and carry onward.
I get dropped into a dashboard, that doesn’t give me a whole lot. If I click the link from
Get a summary of basic metrics at your System Overview dashboard.
I get an overview of my laptop’s system metrics. Mildly surprising. Oh well.
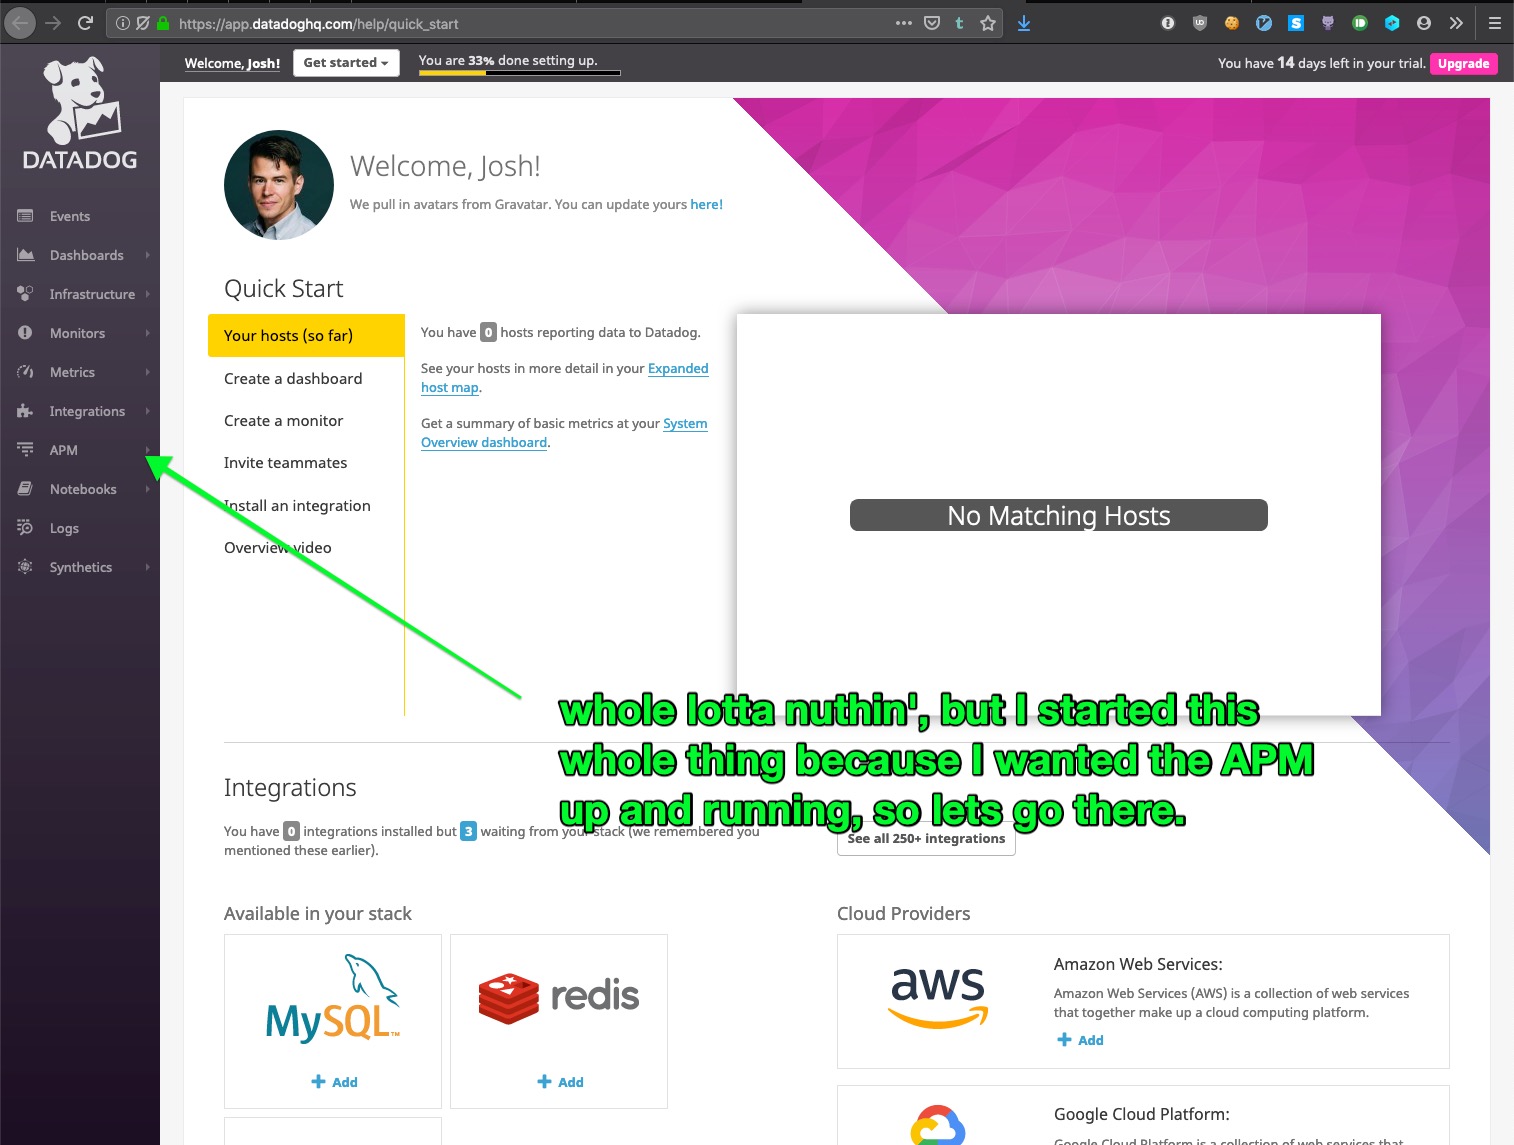
Click the APM button and… yay, a “get started” button.
This is a quick sidebar on ‘feature discoverability’ in an application:
I’d clicked this APM tab before, when in my work Datadog account for other purposes.
Whatever plan my company is on doesn’t have Application Performance Monitoring set up, so we cannot use the feature.
The way this “feature unavailability” was displayed in the UI to me was a the same page in the following screenshot, it was just missing the Get Started button.
So, there I was, a developer wanting to use an expensive monitoring tool, trying to set it up, and when I first found this, I just gave up on the project.
The page should see that I’m on an account spending many dolalrs/month with DataDog, and should make it very easy for me to contact someone about enabling a trial of this feature.
I expect that if we start using this tool, it’s tens of thousands of dollars per year of additional income for DataDog.
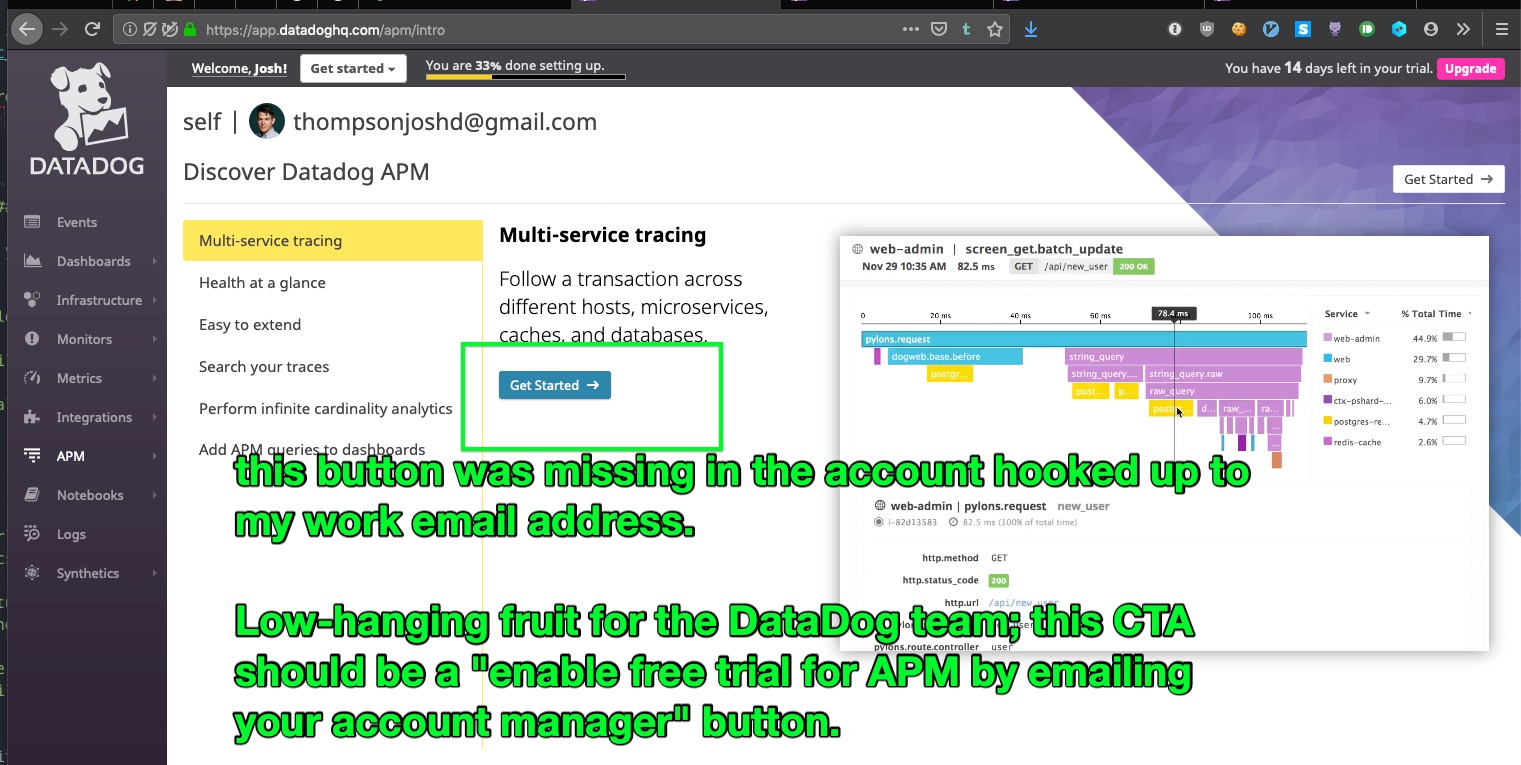
Oh well. Not my problem.
I clicked the Get Started button, and am asked to choose a language:
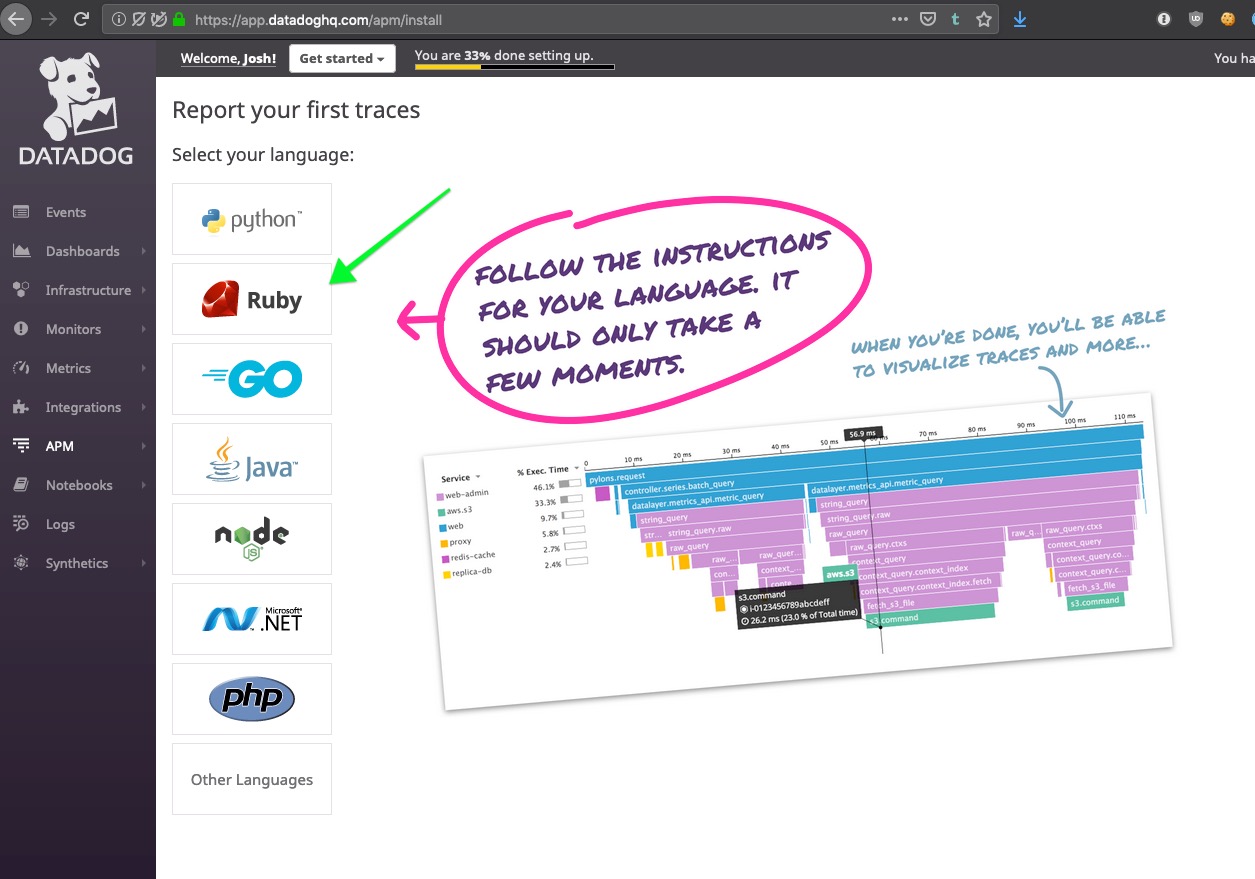
This process is significantly better than working through the docs:
I clicked the Rails button:
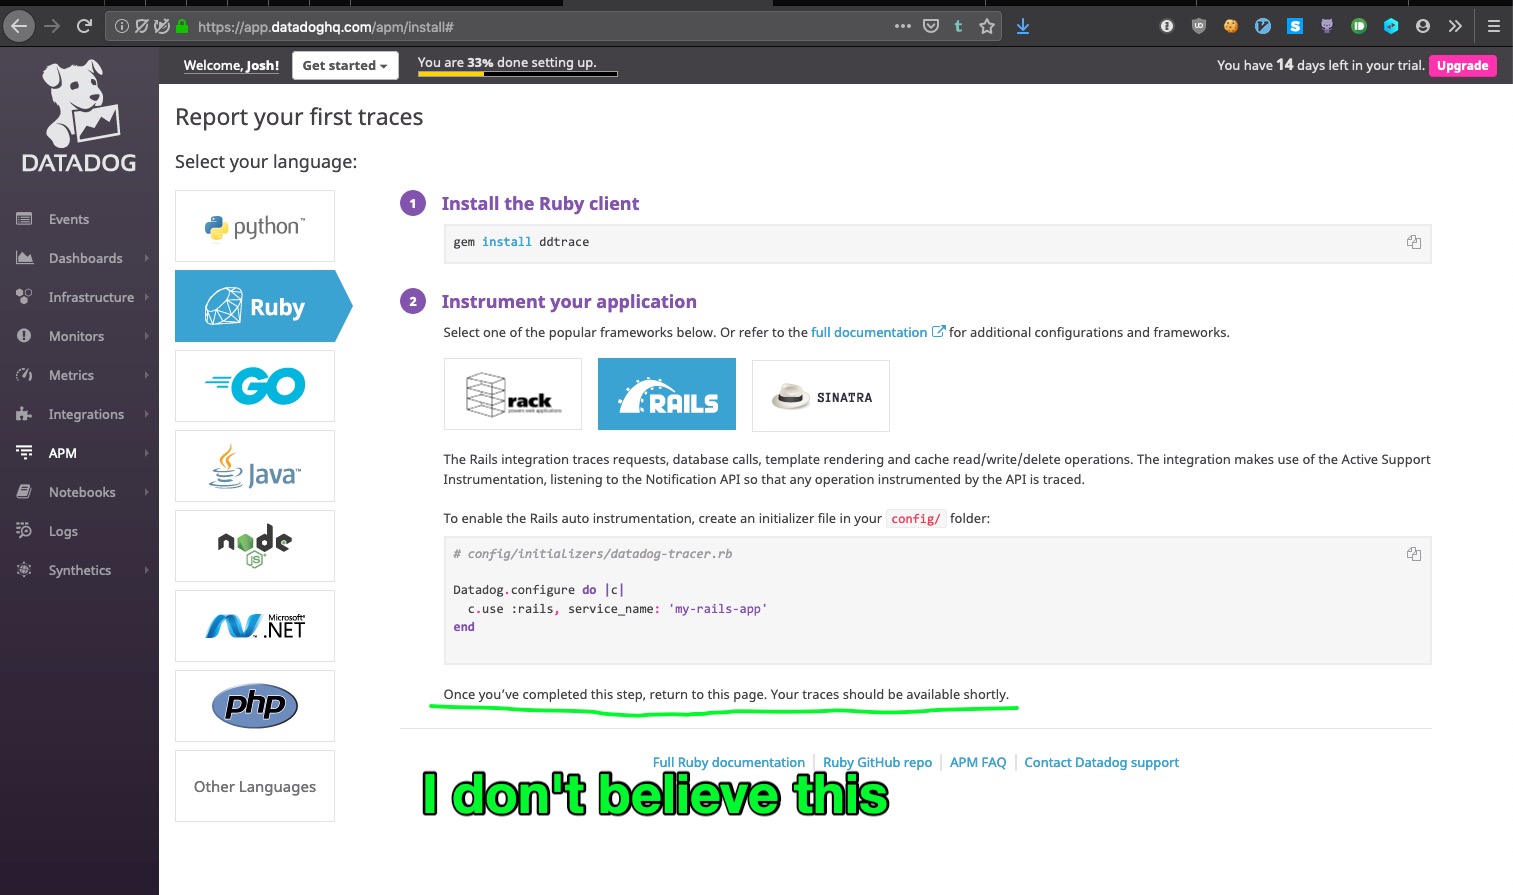
I’m skeptical. I’m not even running my app locally.
Maybe if I add the initializer and then do rails serve, Datadog will start getting information, but they should say as much.
So, I’ll fire up my rails server locally… interact with the app a bit (like logging in) and…
A little bit of wonky CSS, but I think we’re making progress.
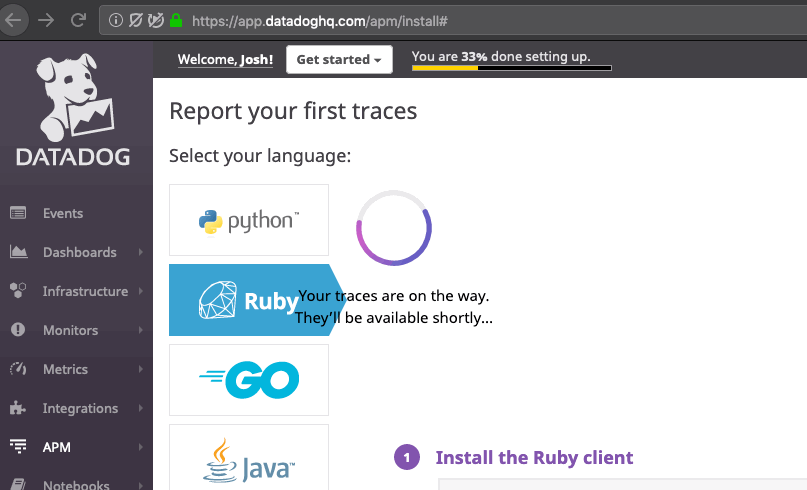
The page was frozen, so I did a hard refresh, then rebuilt the URL to get me to https://app.datadoghq.com/apm/services, and we’re in business:
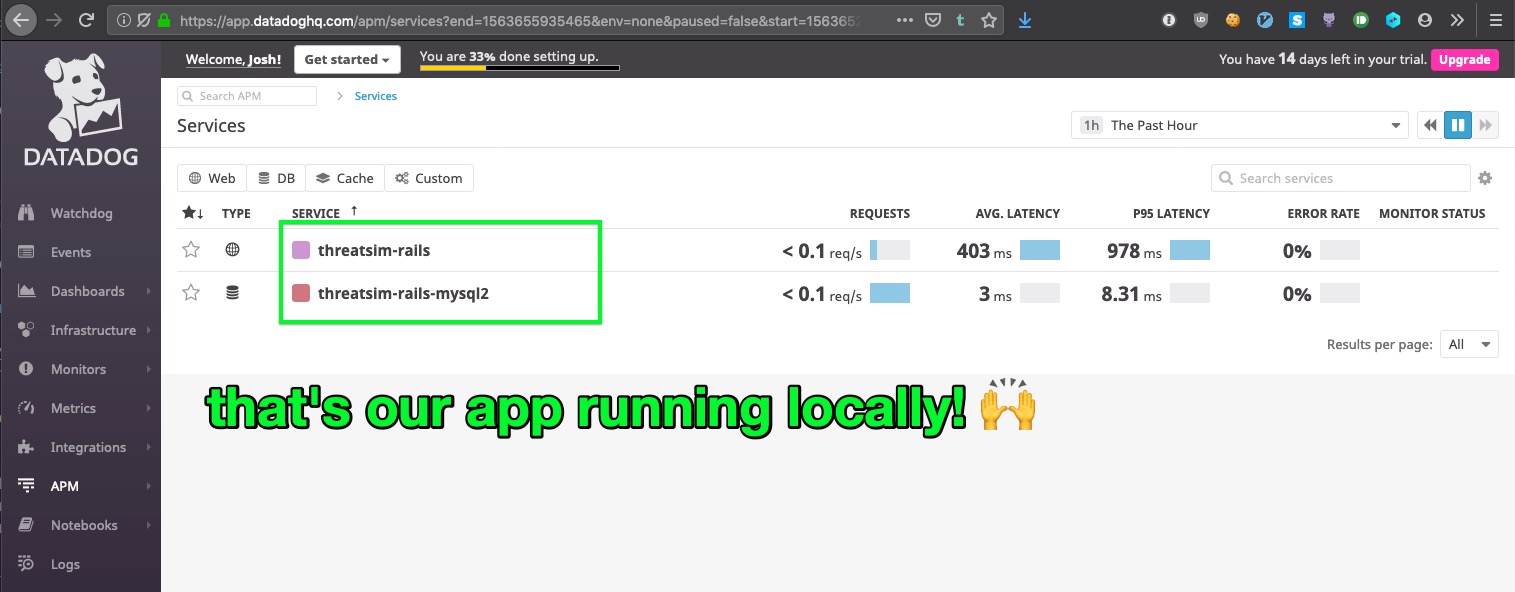
I’m going to end this post here. Next, I’ll see what sort of things we can learn from Datadog while running our app locally, interacting it (or crushing it with siege/apache benchmark) and eventually finding where to make changes to improve the app performance.