Load Testing your app with Siege
Article Table of Contents
- Dumping unique URLs into a text file
- Visiting all of those pages in a Siege test
- Additional Resources
Last time, I dug into using Apache Benchmark to do performance testing on a page that requires authentication to access.
Today, we’ll figure out how to use siege to visit many unique URLs on our page, and to get benchmarks on that process. I’ll next figure out performance profiling in Datadog, and with these three tools put together, we should be ready to make some meaningful improvements to our application.
This series of posts is a direct result of Nate Berkopec’s The Complete Guide to Rails Performance, with aid from his screencasts, as well as Steve Grossi’s Load Testing Rails Apps with Apache Bench, Siege, and JMeter. Armed with these resources, and standing on shoulders of giants, off we go.
Siege’s description:
Siege is an http load testing and benchmarking utility. It was designed to let web developers measure their code under duress, to see how it will stand up to load on the internet. Siege supports basic authentication, cookies, HTTP, HTTPS and FTP protocols. It lets its user hit a server with a configurable number of simulated clients. Those clients place the server “under siege.”
You can get siege with brew install siege.
I’m using it because it can run a list of URLs you give it. Imagine your app is a store, and it lists a few thousand products. Each product should have a unique URL, something like www.mystore.com/product-name, or maybe www.mystore.com/productguid-product-name. That product-guid makes sure that you can have unique URLs, even if there are two items with the same product name.
Knowing what’s in your database, you can easily concat product-guid and product-name, stick it to the end of www.mystore.com, and come up with a list of a hundred or a thousand or ten thousand unique product URLs in your application. If you saved these to a text file and had Siege visit every single one of those pages as quickly as possible… this might look like some sort of good stress test, huh?
Dumping unique URLs into a text file #
You’ll probably start working in a rails console session, to figure out how to access the URL scheme just right.
I fired up the console, and entered:
File.open("all_campaign_urls.txt", "w") do |file|
  # this opens the file in write mode; will over-write contents of file if it exists
  Campaign.where(account_id: 4887).find_each do |campaign|
    puts "writing " + "http://localhost:3000/account/campaigns/" + campaign.to_param
    file.puts "http://localhost:3000/account/campaigns/" + campaign.to_param
  end
end
I looked in our dev database to find an account with a lot of data; account with the id 4887 is an account associated with QA automation, and has lots of data in it.
campaign.to_param is how we build URLs out of our campaigns - it just concats the guid with the title string, as provided by the customer, and calls .parameterize on it. For this batch of campaigns, they’re generated programmatically by our automated QA test suite.
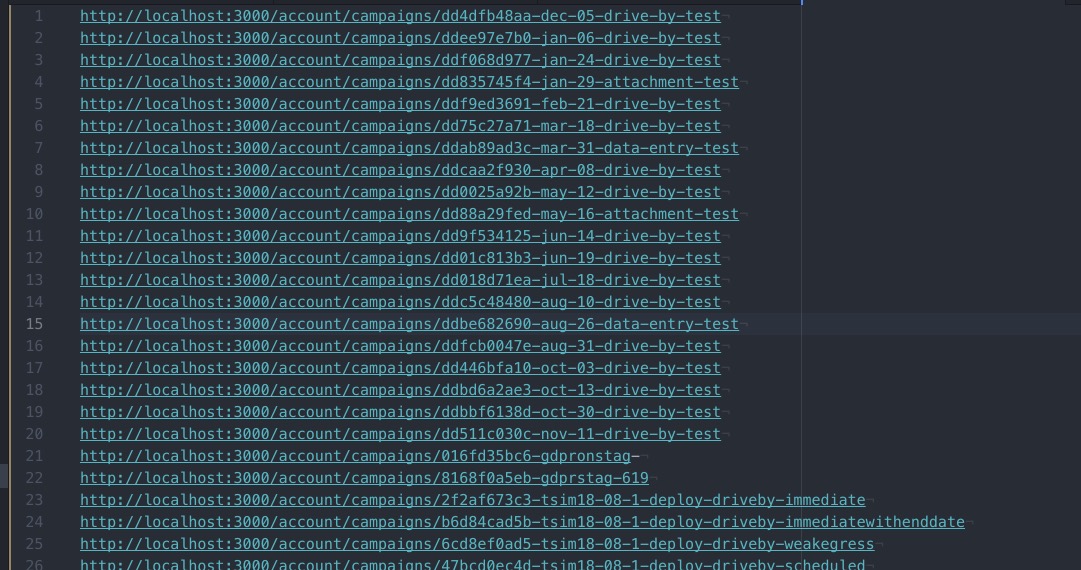
When finished, you might see something like this in all_campaign_urls.txt:
Visiting all of those pages in a Siege test #
So, you can siege --help and see a flag for passing in a file:
$ siege --help
SIEGE 4.0.4
Usage: siege [options]
       siege [options] URL
       siege -g URL
Options:
  -V, --version             VERSION, prints the version number.
  -h, --help                HELP, prints this section.
  -C, --config              CONFIGURATION, show the current config.
  -v, --verbose             VERBOSE, prints notification to screen.
  -q, --quiet               QUIET turns verbose off and suppresses output.
  -g, --get                 GET, pull down HTTP headers and display the
                            transaction. Great for application debugging.
  -p, --print               PRINT, like GET only it prints the entire page.
  -c, --concurrent=NUM      CONCURRENT users, default is 10
  -r, --reps=NUM            REPS, number of times to run the test.
  -t, --time=NUMm           TIMED testing where "m" is modifier S, M, or H
                            ex: --time=1H, one hour test.
  -d, --delay=NUM           Time DELAY, random delay before each requst
  -b, --benchmark           BENCHMARK: no delays between requests.
  -i, --internet            INTERNET user simulation, hits URLs randomly.
  -f, --file=FILE           FILE, select a specific URLS FILE.
  -R, --rc=FILE             RC, specify an siegerc file
  -l, --log[=FILE]          LOG to FILE. If FILE is not specified, the
                            default is used: PREFIX/var/siege.log
  -m, --mark="text"         MARK, mark the log file with a string.
                            between .001 and NUM. (NOT COUNTED IN STATS)
  -H, --header="text"       Add a header to request (can be many)
  -A, --user-agent="text"   Sets User-Agent in request
  -T, --content-type="text" Sets Content-Type in request
      --no-parser           NO PARSER, turn off the HTML page parser
      --no-follow           NO FOLLOW, do not follow HTTP redirects

Copyright (C) 2017 by Jeffrey Fulmer, et al.
This is free software; see the source for copying conditions.
There is NO warranty; not even for MERCHANTABILITY or FITNESS
FOR A PARTICULAR PURPOSE.
Already I know we’re going to need --file, and --header, as we’ll need to fake authenticated sessions by submitting some cookies, the process for which I outlined last time
The --get flag looks useful:
GET, pull down HTTP headers and display the transaction. Great for application debugging.
So, lets log in as our QA account. Since I’m running this all locally, I can find the associated email address in our DB. I don’t know the password, of course, but I can force a local password reset, grab the email in Mailcatcher, and set it to whatever password I want.
Lets get these headers in.
We can make a cURL test request with our cookies. When I do
$ curl -v http://localhost:3000/account/campaigns/dd4dfb48aa-dec-05-drive-by-test
I expect to see the page come back, not a redirect to /users/sign_in
What I expect a failed authentication to look like:
*   Trying ::1...
* TCP_NODELAY set
* Connection failed
* connect to ::1 port 3000 failed: Connection refused
*   Trying 127.0.0.1...
* TCP_NODELAY set
* Connected to localhost (127.0.0.1) port 3000 (#0)
> GET /account/campaigns/dd4dfb48aa-dec-05-drive-by-test HTTP/1.1
> Host: localhost:3000
> User-Agent: curl/7.54.0
> Accept: */*
>
< HTTP/1.1 302 Found
< Location: http://localhost:3000/users/sign_in
< Content-Type: text/html; charset=utf-8
< Cache-Control: no-cache
< Set-Cookie: _ts_session_id=94f33f8f3c53608e0d54da4735ab6ef4; path=/; expires=Sun, 07 Jul 2019 16:46:59 -0000; HttpOnly; SameSite=Lax
< Set-Cookie: __profilin=p%3Dt; path=/; HttpOnly; SameSite=Lax
.
.
.
* Connection #0 to host localhost left intact
<html><body>You are being <a href="http://localhost:3000/users/sign_in">redirected</a>.</body></html>%
cookies:
_ts_session_id: c86fd1fe38d7a6c56ce1ef5990045057
fd827a2c5655094bcce3748d6ee6d3e4: ImRhMDY1YjdjYjMwNGNjNWUxNzFkNDhjOGQ0YzA0OTIwIg%3D%3D--98c228cb35af1a269ee894c22540b81848e2ed09
And we’re in business:
$ siege --header="Cookie: _ts_session_id=c86fd1fe38d7a6c56ce1ef5990045057, \
fd827a2c5655094bcce3748d6ee6d3e4=ImRhMDY1YjdjYjMwNGNjNWUxNzFkNDhjOGQ0YzA0OTIwIg%3D%3D--98c228cb35af1a269ee894c22540b81848e2ed09" \
-f all_campaign_urls.txt
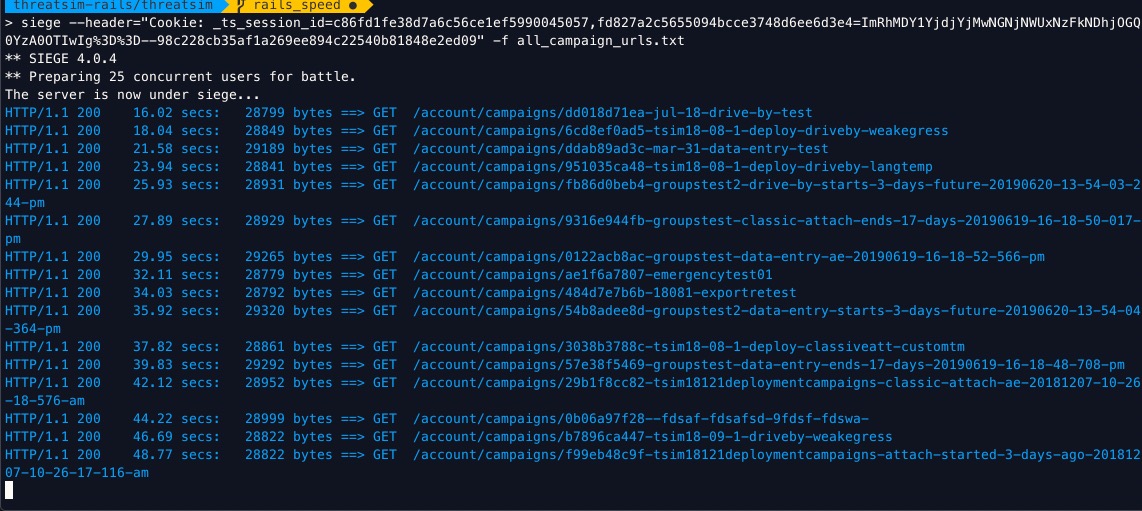
Notice those status codes of 200? I can tail -f log/development.log and see all the activity, indicating that the submitted cookies are associated with an authenticated user.
First thing I notice is it seems like these are extremely long page-load times.
I’m having Siege load about 162 different URLs. When you run siege with the default configuration, it runs 20 simultaneous users. This seemed to be a bit much for what my localhost could handle, so I tried dropping the number of concurrent users first to two users, then to one.
To set the number of concurrent users, just add the --concurrent=NUM flag. I was still flooded with output, so I dropped concurrent users to 1 and removed all but 20 pages from the list of pages to load up. I gave it a time flag of 60 seconds, as well: -t 60s
When all is said and done, you’ll see siege making a bunch of timed GET requests, like so:
Eventually, everything will settle out, and you’ll get a summary of the load test:
Lifting the server siege...
Transactions:		         101 hits
Availability:		      100.00 %
Elapsed time:		       59.24 secs
Data transferred:	       20.73 MB
Response time:		        0.58 secs
Transaction rate:	        1.70 trans/sec
Throughput:		        0.35 MB/sec
Concurrency:		        0.99
Successful transactions:         101
Failed transactions:	           0
Longest transaction:	        1.99
Shortest transaction:	        0.00
Yeah, OK, this is cool, Josh, but how the heck am I supposed do anything useful with this?
Great question! Its time to see where our app is spending most of its time, out in the real world. We could do more benchmarking locally, but obviously real-world data, gathered from real people interacting with your real app in production is the most useful source of data.
Therefore, I'll soon be writing I have written about how to get useful data from a Rails app into DataDog!